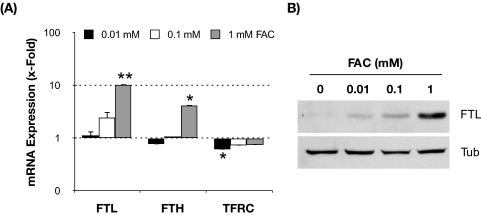
Figure 2.
Expression levels of genes involved in intracellular iron homeostasis in TM cells supplemented with increasing concentrations of FAC for 3 days. (A) Relative mRNA expression levels quantified by qPCR compared with nontreated cells. Values represent mean ± SD. *P < 0.05; **P < 0.005; n = 3. (B) Representative Western blot of FTL protein levels with increasing concentrations of FAC.

