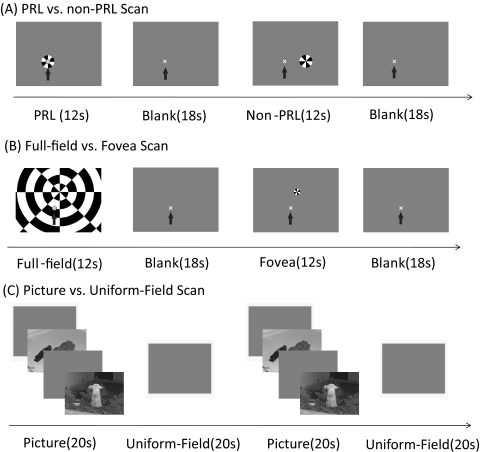
Figure 1.
Illustration of functional scans. (A) One cycle of blocks in the PRL versus non-PRL scan. Arrow points to the location of the fixation cross (i.e., the PRL); arrow was not present in the experiments. The fixation cross was green in the actual experiments. (B) One cycle of blocks in the full-field versus fovea scan. Arrow points to the location of the fixation cross; arrow was not present in the experiments. The fixation cross was green in the actual experiments. (C) Two cycles of blocks in the picture versus uniform-field scan.

