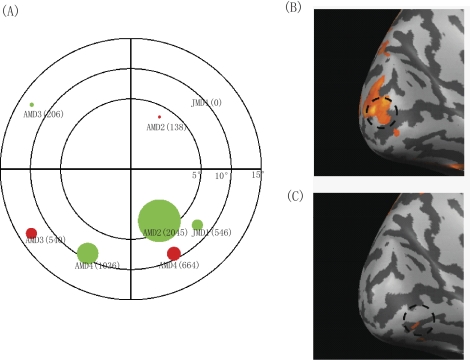
Figure 2.
Number of activated voxels for the stimulus at PRL or non-PRL locations. (A) Green circles represent the spatial extent of brain activation with the stimulus at the PRL for AMD2, AMD3, AMD4, and JMD1, and red circles represent the stimulus at the non-PRL location. The diameter of the circles is proportional to the number of activated voxels, and the center of the circles is the location of the stimulus in the visual field. The actual number of voxels for the region of activation in early visual cortex is also noted in brackets. A log scale was used for the eccentricity axis to reflect the logarithmic mapping along the eccentricity axis of the visual field on early visual cortex. (B, C) Example of brain activation maps with the stimulus at the PRL (B) and the control location (C) for AMD2.

