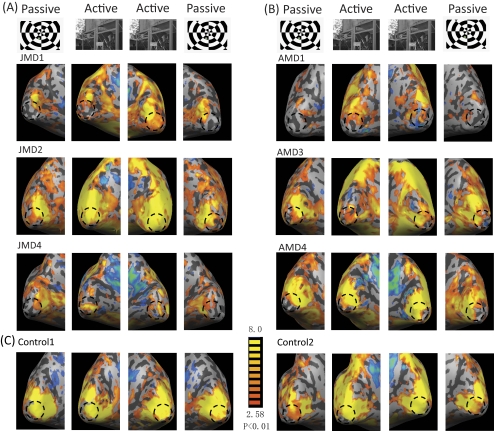
Figure 3.
Brain activation maps for passive and active viewing conditions. (A) Results for JMD subjects. (B) Results of AMD subjects. (C) Control subjects. First column: brain activation map of the left hemisphere (LH) with passive viewing. Second column: brain activation map of LH with active viewing. Third column: brain activation map of the right hemisphere (RH) with active viewing. Fourth column: brain activation map of RH with passive viewing. Dashed circle: foveal region of the cortex. By comparison, the silent zone within the dashed circle is reduced with active viewing in MD subjects, and this reduction is more significant in JMD subjects. The color coding of the brain activation map represents the confidence level (t value). Yellow: most confident; red: less confident; blue: negative signal change. The threshold was set as P < 0.01.

