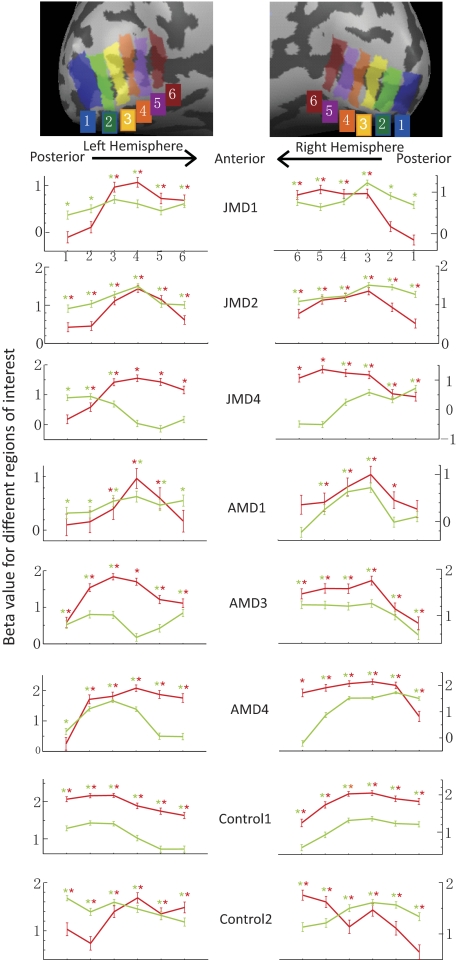
Figure 4.
ROI analysis of cortical responses in the primary visual cortex. Top: illustration of ROI selection. Left: results for the left hemisphere (LH). Right: results for the right hemisphere (RH). The x-axis represents different ROIs along the calcarine sulcus. Posterior to anterior is left-to-right in LH and right-to-left in RH. The y-axis is the beta value for ROIs for different experimental conditions. Red curves: passive viewing condition. Green curves: active viewing condition. *P < 0.05; significant activation. Red star: significant activation with passive viewing. Green star: significant activation with active viewing.

