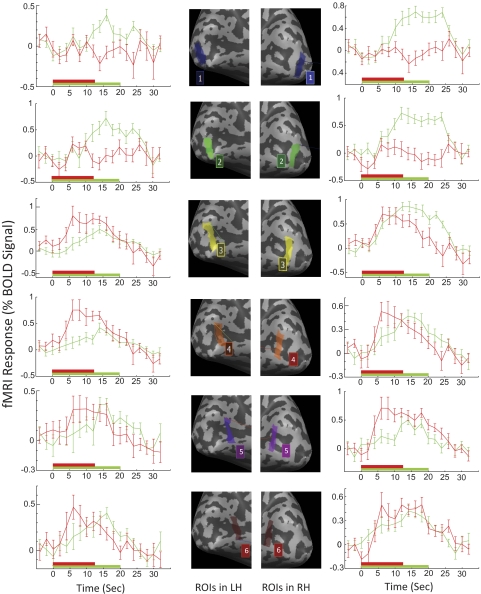
Figure 5.
BOLD time course of ROIs in JMD1. Left column: results from the left hemisphere. Right column: results from the right hemisphere. Top to bottom: time courses of ROIs from the posterior region to the anterior region of the calcarine sulcus. Green curves: active viewing condition in the picture versus uniform-field scan. Red curves: full-field passive viewing condition in the full-field versus fovea scan. The x-axis is time since the block onset (seconds). The stimulus was present for 20 seconds in active viewing (green bar above the x-axis) and for 12 seconds in passive viewing (red bar above the x-axis). Only active viewing showed significant activation in the first two ROIs at the posterior region of the calcarine sulcus.

