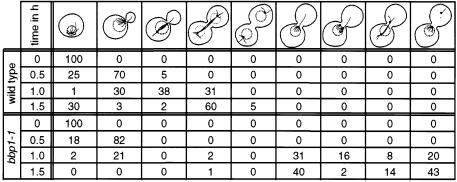
Table I. Phenotypic analysis of synchronized bbp1-1 cells.
Wild-type and bbp1-1 cells were synchronized with α-factor and shifted to 37°C as described in the legend to Figure 3. Cells were fixed with formaldehyde for 1 h and analysed by indirect immunofluorescence using rabbit anti-Spc72p and mouse anti-tubulin antibodies. DNA was stained with DAPI. About 200 cells were counted per time point. The SPB is indicated as a dot. The DAPI staining region is drawn as a dotted circle. Values given as percentages.

