Figure 1.

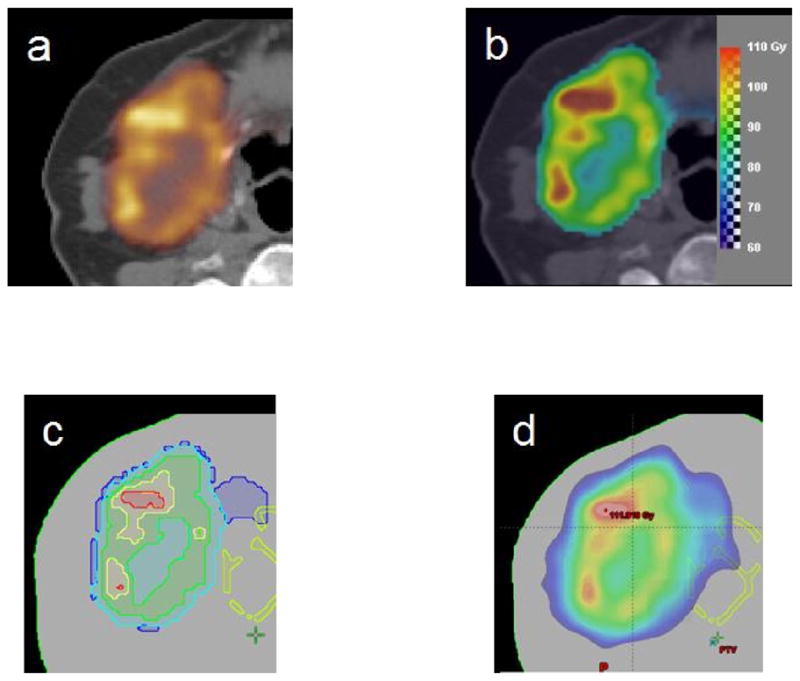
(a) The Cu-ATSM PET image for the patient, (b) the dose prescription map, (c) the substructures corresponding to five dose prescription levels, (d) an example of the optimised dose.

(a) The Cu-ATSM PET image for the patient, (b) the dose prescription map, (c) the substructures corresponding to five dose prescription levels, (d) an example of the optimised dose.