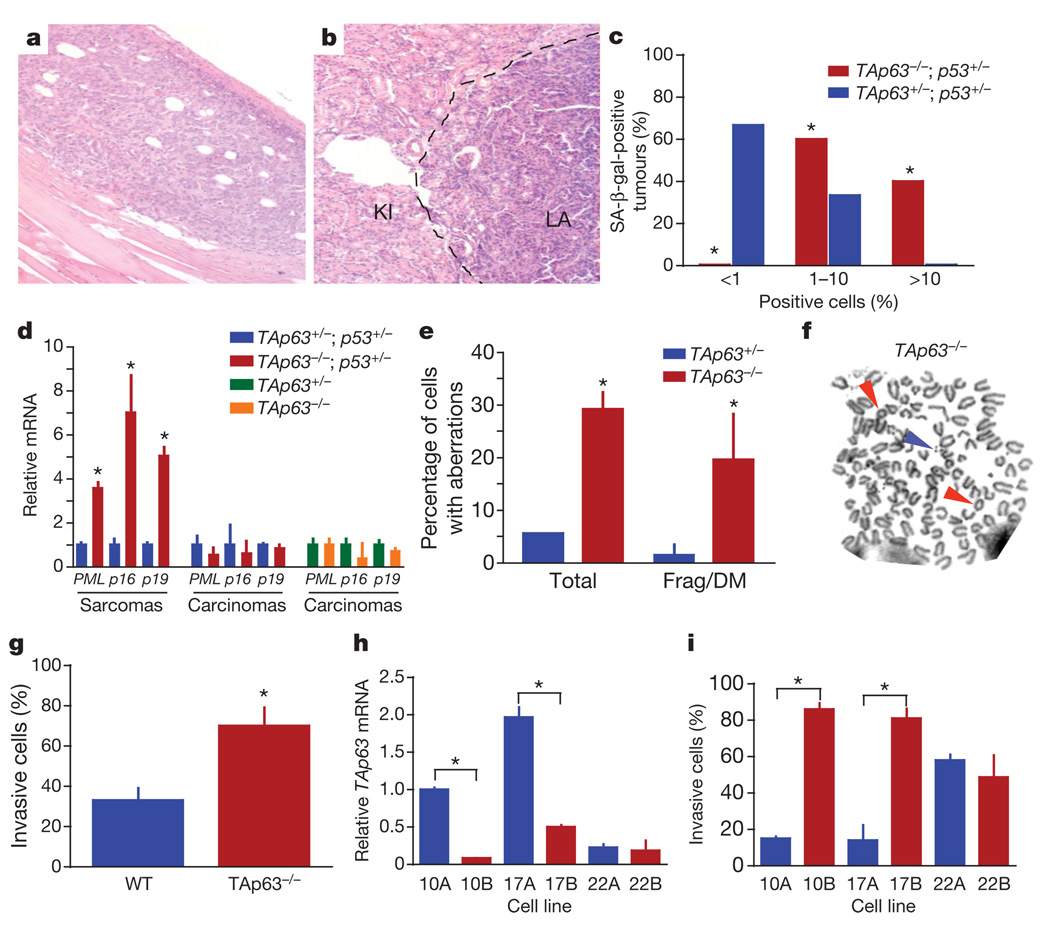
Figure 2. TAp63-deficient tumours show high levels of senescence and genomic instability.
a, b, Non-metastatic osteosarcoma (a) and metastatic lung adenocarcinoma (LA) in kidney (KI) (b) from TAp63−/−;p53+/− mouse. c, Percentage of SA-β-gal-positive sarcomas; n = 6 of each genotype. d, Quantitative real-time polymerase chain reaction (qRT-PCR) for markers of senescence (PML, p16Ink4a and p19Arf) in the indicated tumours; n = 6 of each genotype. e, Percentage of TAp63−/− and TAp63+/− tumours with chromosomal aberrations determined by metaphase spreads; n = 6 of each genotype. Frag/DM, fragmented, double-minute chromosome. f, Representative metaphase spread from a TAp63−/− tumour. Coloured arrows indicate aberrations: rings (red arrows) and double minutes (blue arrow). g, Invasion assays in wild-type MEFs (n = 3) and TAp63−/− MEFs (n = 3). h, qRT-PCR for TAp63 in the indicated human squamous cell carcinoma (HNSCC) cell lines; n = 5. i, Invasion assays in HNSCC cell lines; n = 5. Error bars indicate s.e.m. Asterisk, P ≤ 0.05.

