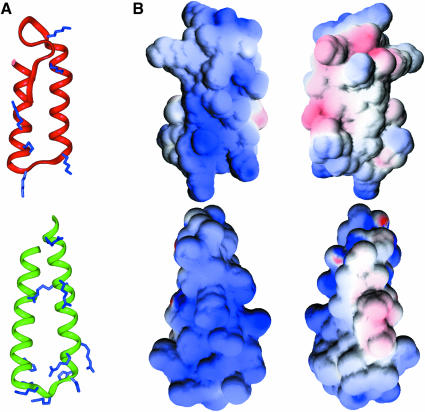
Fig. 5. (A) Ribbon diagram of the lowest energy structure of R1B (3–51) (top), compared with another RNA-binding protein, S15 (24–71) (bottom). The conserved basic residues in both families are indicated. (B) Electrostatic surface potential of R1B [in front view, same orientation as in (A)] and S15 [slightly rotated compared with (A)], and 180° rotated view. Positive and negative charges are shown in blue and red, respectively. The figures were generated using GRASP (Nicholls et al., 1991).

An official website of the United States government
Here's how you know
Official websites use .gov
A
.gov website belongs to an official
government organization in the United States.
Secure .gov websites use HTTPS
A lock (
) or https:// means you've safely
connected to the .gov website. Share sensitive
information only on official, secure websites.
