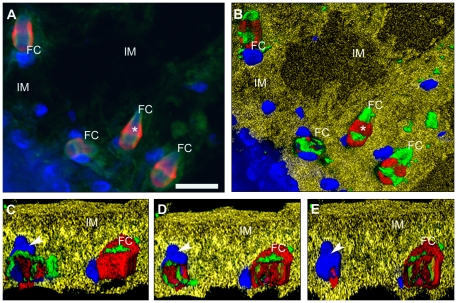
Figure 4. Reconstruction and 3D visualization of flame cells.
A) Fluorescent staining of F-actin, α-tubulin and nuclei as indicated in Figure 2F. B) A reconstruction and visualization of the image in A after rendering and reconstructing by AMIRA software a stack of ∼20 images. False colors, similar to those seen by fluorescence, were associated to cytoskeletal proteins and nuclei of flame cells (FC) and, in order to reconstruct the interstitial matrix (IM), a yellow color was selected. Rotation (90°) of the focal plane of FC (C–E), after digital cross sectioning of the image in B, is showing that inside of the clasp the F-actin is forming a cage. 3D visualization of the button panel shows that FC are embedded in tunnels formed in the matrix (see Movie S5). Scale bar = 10 µm.

