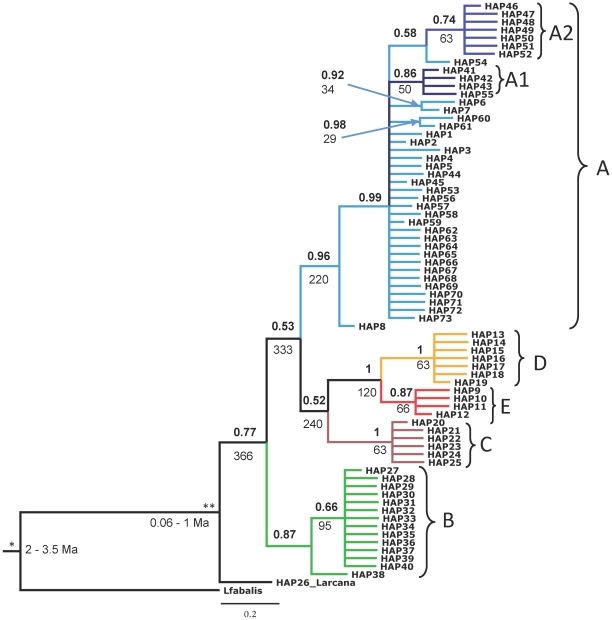
Figure 3. Bayesian phylogenetic tree of Littorina saxatilis mitochondrial cytochrome-b haplotypes with coalescence times estimated in BEAST.
Littorina fabalis is included as the outgroup for the tree. Numbers above the nodes refer to posterior probabilities of the clades (probabilities <0.5 are not shown). Clades with posterior probabilities >0.7 (A–E, A1, A2) are indicated by different colours (see Fig. 4 for their frequencies in different populations demonstrated as pie charts). Mean TMRCAs for these clades in ka are given below the nodes, together with the two utilized calibration points: fossils (*) and allozyme divergence (**). Sequence accession numbers are provided in Table S3.

