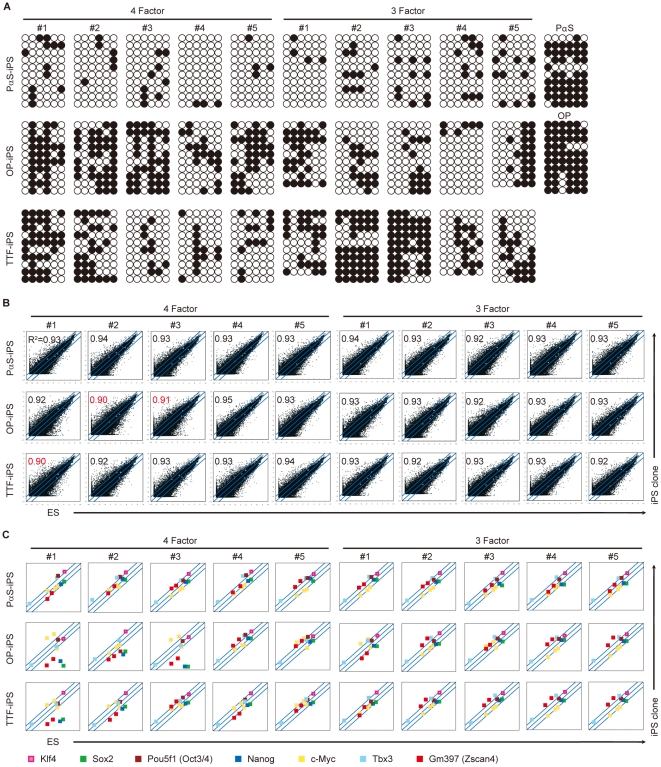
Figure 3. Characterization of iPS cells and PαS cells.
A, DNA methylation of the promoter region of the Nanog gene. White circles indicate unmethylated CpG dinucleotides; black circles indicate methylated CpG dinucleotides. B, Scatter plots showing the comparison of global gene expression between ES cells and PαS-iPS, OP-iPS, and TTF-iPS cells determined by DNA microarray. Red number; R2 values over 0.92 compared with ES cells as positive. C, Microarray Scatter Plots were especially showing klf4, Sox2, Pou5f1 (Oct3/4), Nanog, c-Myc, Tbx3, and GM397 (Zscan4) gene.

