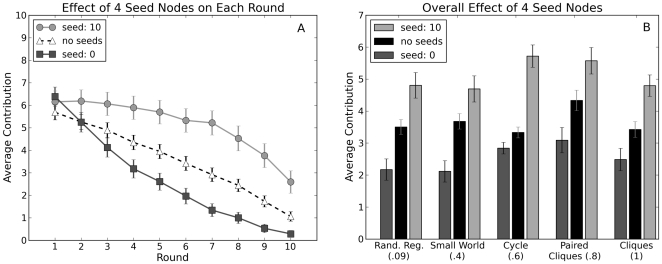
Figure 7. Contributions for cover-seed experiment.
(A) Average contribution per round for the cooperating and defecting conditions averaged over all realizations and all topologies. (B) Overall average contribution for each topology under the cooperating, defecting and all human conditions. The clustering coefficient for each network is listed in parenthesis. In both panels error bars indicate 95% confidence intervals.

