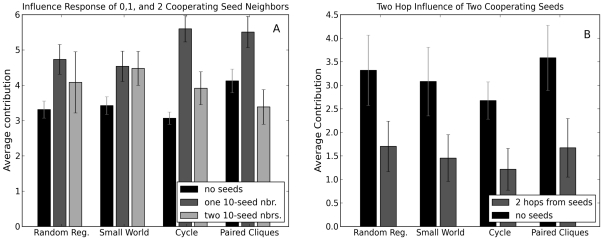
Figure 10. Contributions for concentrated-seed experiment.
(A) The average contribution of human players neighboring 0, 1 or 2 cooperating seed nodes. (B) The average contribution of the human players 2 hops from 2 seed nodes compared to the average contribution of the corresponding nodes in the all human experiments. In both panels error bars indicate 95% confidence intervals.

