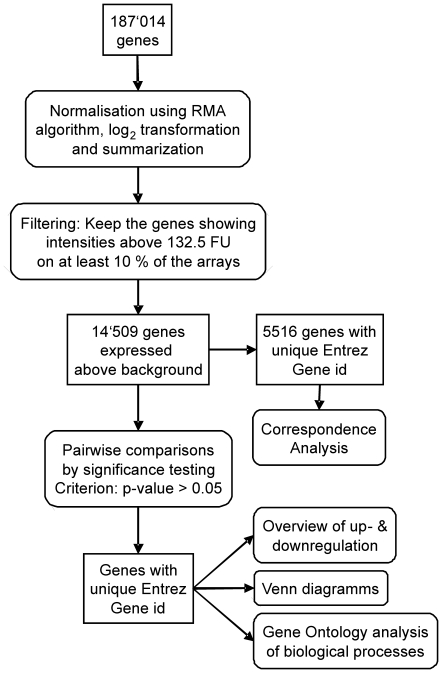
Figure 1. Workflow of the gene expression analysis of the microarray data.
Square textboxes represent the gene lists at the different steps of the workflow and round-edged textboxes represent the different steps performed for data analysis. RMA = Robust Multi-array Average, FU = fluorescence units, id = identifier.

