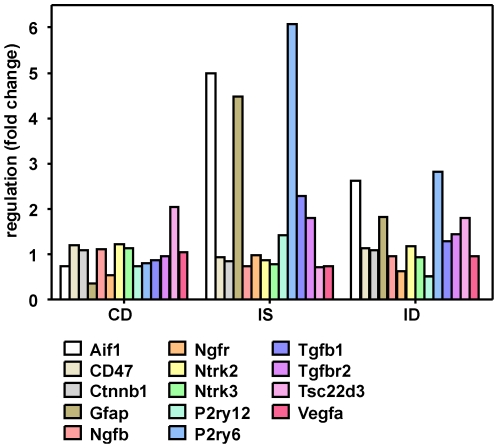
Figure 6. Gene expression pattern of the quantitative real-time PCR analysis in the hippocampus.
The three experimental groups were compared to control and saline-treated animals. These 14 genes were significantly regulated when comparing infected and dexamethasone-treated animals with infected and saline-treated animals (ID vs. IS). C = control animals, D = dexamethasone treatment, I = infected animals, S = saline treatment.

