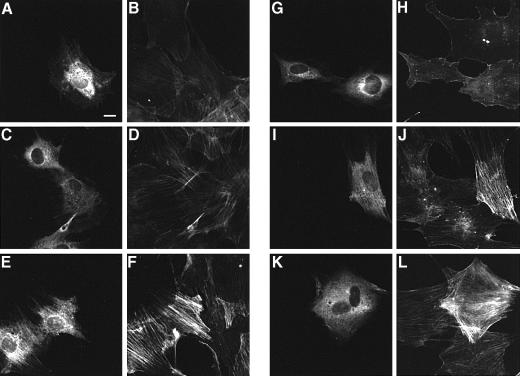
Fig. 5. Formation of actin stress fibers in MC3T3–E1 cells microinjected with RhoA. Microinjected cells were distinguished by staining with Alexa 488–anti-rabbit IgG (A, C, E, G, I and K) and the actin cytoskeleton was visualized by staining with Alexa 568–phalloidin (B, D, F, H, J and L). Cells were microinjected with 400 μg/ml control RhoA (A, B, I and J), 400 μg/ml RhoA treated with DNT in the absence of spermidine (C, D, K and L) or 200 μg/ml RhoA treated with DNT in the presence of spermidine (E–H). (G and H) Cells were incubated in the presence of 30 μM Y27632 for 1 h after microinjection. (I–L) The GTPases were pre-loaded with 120 μM GTPγS before microinjection. Bar, 10 μm.

An official website of the United States government
Here's how you know
Official websites use .gov
A
.gov website belongs to an official
government organization in the United States.
Secure .gov websites use HTTPS
A lock (
) or https:// means you've safely
connected to the .gov website. Share sensitive
information only on official, secure websites.
