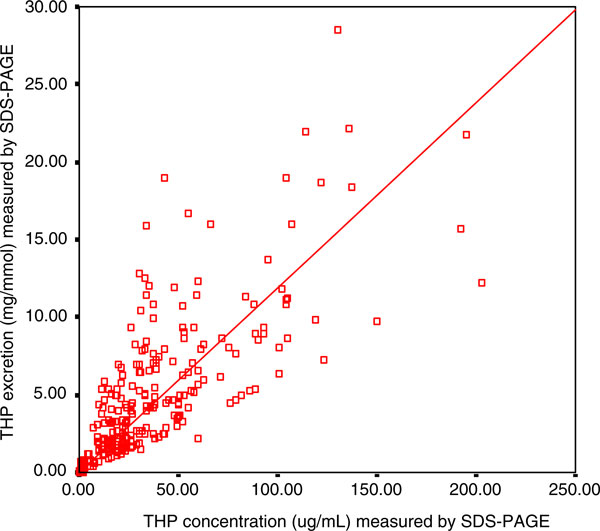
Figure 8.
The correlation between THP concentration and THP excretion measured by SDS-PAGE. The □ symbols represent the THP level of an individual urine sample with its corresponding THP concentration and THP excretion. The THP concentration was correlated positively to THP excretion (r = 0.781, P = 0.002). The level of significance according to Pearson correlation of coefficient was set to alpha = 0.01.

