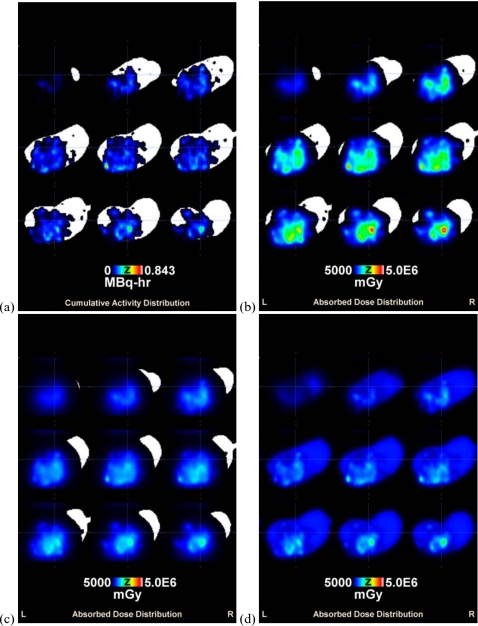
Figure 1.
Intratumoral cumulative activity and absorbed dose distributions overlaid on the binary image of excised tumor showing every third slice. (a) Cumulative activity distribution for 186Re liposomes resulting from the single injection location, (b) resulting 186Re-liposome absorbed dose distribution from the cumulative activity distribution of (a), (c) resulting 188Re-liposome absorbed dose distribution from the same cumulative activity distribution of (a), and (d) resulting 186Re-liposome absorbed dose distribution following the multiple injection location simulation.

