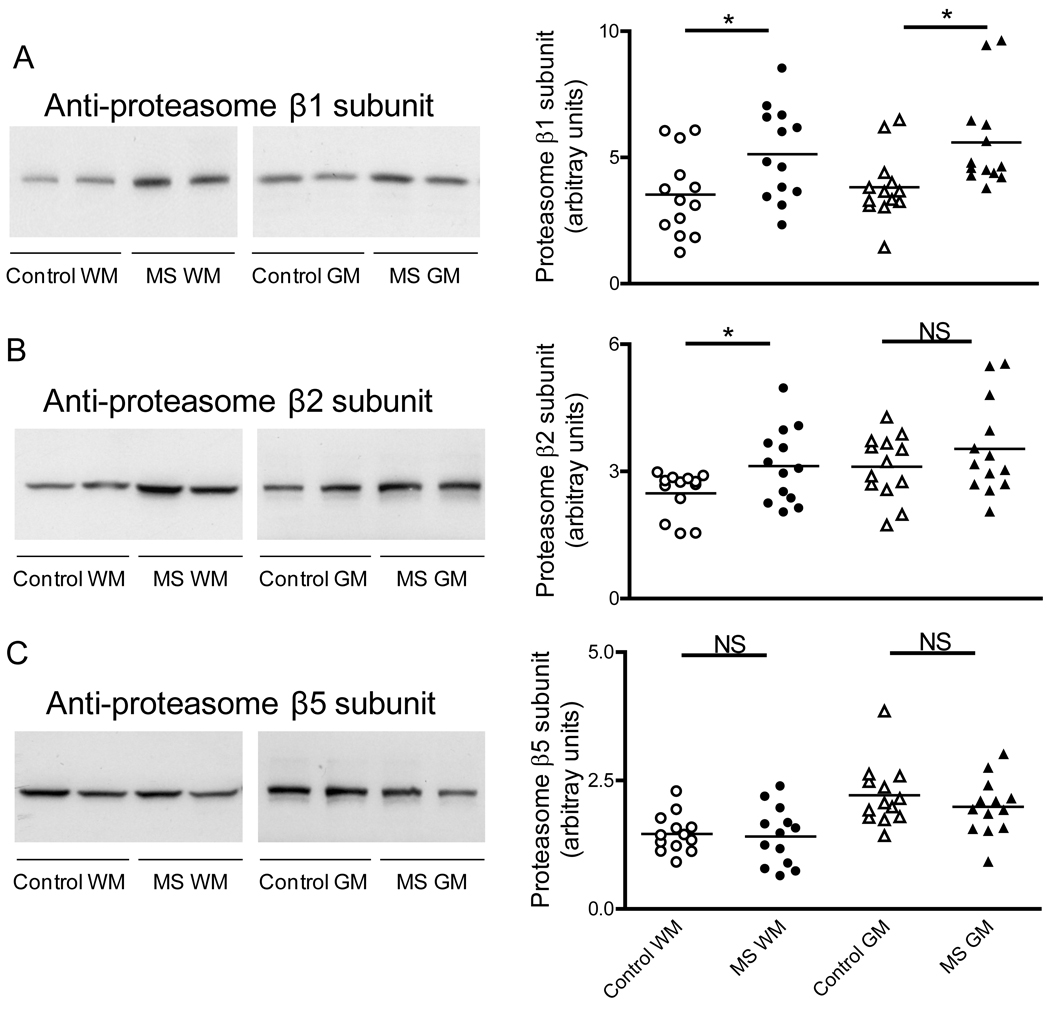
Fig. 4.
Levels of 20S proteasome β1, β2 and β5 subunits are not decreased in MS. Left three panels show representative immunoblots from homogenates of brain WM and GM areas of control and MS patients developed with antibodies against the β1 subunit (A), β2 subunit (B) and β5 subunit (C) of the 20S proteasome. Right panels depict the corresponding levels of each of the β subunits, which were calculated by dividing band intensity on the western blot by that of the corresponding coomassie blue stained lane. Each point represents a patient and the horizontal bar is the average. *p<0.05. Other symbols are as in Fig. 1.

