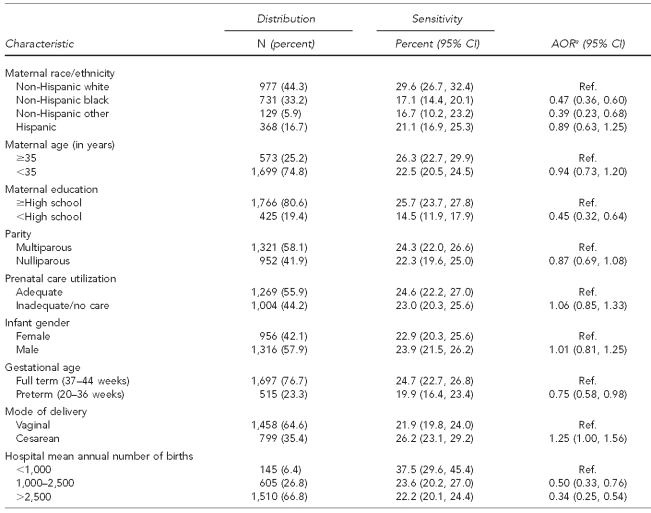
Table 2.
Sensitivity and AOR estimates for associations among maternal, infant, and hospital characteristics and having a true birth defect diagnosis on birth certificates for selected birth defects identifiable at birth, Atlanta, 1995–2005
aAdjusted for all covariates listed in the table
AOR = adjusted odds ratio
CI = confidence interval
Ref. = referent group

