SYNOPSIS
Objectives
We determined the trends, risk factors, and costs of emergency department (ED) visits for dental complaints during a six-year period in Kansas City, Missouri (KCMO).
Methods
We used de-identified hospital discharge data from all facilities serving KCMO during 2001–2006. Using the International Classification of Diseases, Ninth Revision codes, we determined both counts and rates of ED visits related to toothache or tooth injury and analyzed the discharge diagnosis and costs of these visits. We used multivariable regression analysis to assess risk factors for the ED visits for dental complaints.
Results
We found a significant increasing trend in dental complaint visits during the six-year period (from 13.1% to 19.0%, p<0.01). Dental caries accounted for 20.4%, pulpitis or periapical abscess accounted for 14.8%, dental injury accounted for 8.7%, temporomandibular joint (TMJ) disorders accounted for 1.5%, and all other unspecified dental diseases accounted for 54.6% of the ED visits for dental complaints. The mean charge was approximately $360 per visit and was highest for TMJ disorders ($747) and lowest for unspecified other dental diseases ($277). Self-pay (38.3%) and Medicaid (32.3%) constituted the majority of the payment sources. Multivariable regression analysis indicated that self-payers, nonwhite people, adults, people with lower family income, and weekends were associated with increased use of ED visits for dental complaints.
Conclusions
There was a significant increasing trend in dental complaint-related ED visits. EDs have become an important site for people with dental problems to seek urgent care, particularly for individuals who self-pay or are on Medicaid.
The Surgeon General's 2001 report on oral health in America recognized oral health as a valued, integral part of general health and well-being.1 The report documented a growing oral health crisis among Americans and identified profound disparities for oral health and significant difficulties in access to dental care for certain segments of the population. The most vulnerable segments of the U.S. population—poor children and racial/ethnic minority groups—experience a disproportional oral health disease burden and usually have serious challenges to obtaining necessary dental care. Many of these patients lack either access to routine dental care or financial resources and rely on hospital emergency departments (EDs) as the primary source of dental care. Consequently, ED physicians, rather than dentists, are asked to diagnose and treat severe tooth pain, infection/swelling, or traumatic injuries to the teeth.2
EDs serve as a point of entry into the health-care system, and studies have documented ED use by people suffering from dental complaints;3–7 however, only a few of these studies used national data, while most studies used records from specific institutions. One national study used the National Hospital Ambulatory Medical Survey data and estimated a mean of 73,800 ED visits for dental care annually, with dental caries, pulpitis/dental abscess, and traumatic injuries being the most common complaints.7 Patients without private insurance, those who live in rural areas, and young adults were more likely to use EDs for dental care. Other studies have found that hospital ED visits for dental care occur more often on weekends and at night.8,9
The knowledge about the patterns and trends of ED visits for dental care is limited because no prior study has analyzed the longitudinal trend of such visits to multiple institutions over several years. Using data collected from 11 hospitals in Kansas City, Missouri (KCMO), during 2001–2006, we conducted a trend analysis to determine the patterns, risk factors, and costs of ED visits for dental care during the six-year period.
METHODS
We conducted a retrospective study of ED visits in KCMO due to dental complaints for the period 2001–2006. We extracted the data from annual de-identified hospital discharge information provided to the Kansas City Health Department by the Missouri Department of Health and Senior Services. We coded the datasets to the International Classification of Diseases, Ninth Revision, Clinical Modification (ICD-9-CM) codes: dental caries (520.1), temporomandibular joint (TMJ) disorders (524.6, 830.0–830.1, 848.1), diseases of pulp and periapical tissues (522.0–522.9), injuries to dentofacial structures (873.51, 873.53, 873.54, 873.63–873.69), and other diseases unspecified (521.2, 521.3, 523, 525–529). We used ZIP codes to identify KCMO residents in the datasets, and we obtained the number of non-dental ED visits from the dataset for comparison.
We conducted analyses using SPSS® version 15.0.10 Variables of interest included gender, age group (0–6, 7–18, 19–35, 36–50, and ≥51 years), race/ethnicity (non-Hispanic white, non-Hispanic black, Hispanic, and other), primary residence ZIP codes, health insurance status (Medicaid, Medicare, self-pay, private, and other), day of week, family income, and community health level.11 In general, race/ethnicity was self-reported, although the registration workers simply assigned it occasionally. As a surrogate measure of income, family income was assigned to individual cases based on the median family income for the primary residence ZIP code reported in the 2000 U.S. Census data. Community health level used seven health zones on the basis of social economic information combining poverty level, median family income, unemployment rate, labor force, and no high school rate. We expressed categorical variables as percentages and compared them by groups using Chi-square tests. We conducted trend analyses of the rates of ED dental visits using logistic regression analysis.
We used multivariable logistic regression analysis to estimate the odds ratios for the percentages of ED visits for dental complaints in comparison with non-dental complaints. Independent variables of interest included age (0–18, 19–50, and ≥51 years), race/ethnicity (non-Hispanic white, non-Hispanic black, Hispanic, and other), day of week (weekday and weekend), health insurance (self-pay and other), and family median income ($20,000–$39,999, $40,000–$59,999, $60,000–$79,999, and ≥$80,000). All independent variables were statistically significant in the bivariate analysis and, thus, chosen for multivariable logistic regression analysis. We assessed the interactions between independent variables and conducted analyses at a significance level of p=0.05.
RESULTS
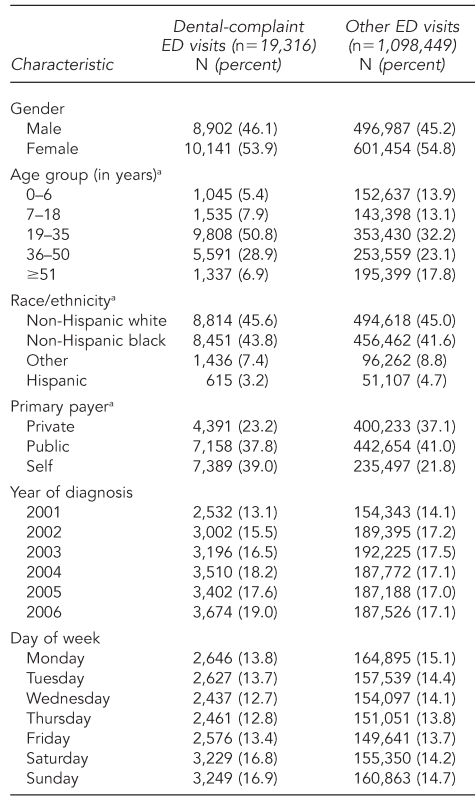
During 2001–2006, KCMO residents made 19,316 visits to EDs for dental complaints, accounting for 1.7% of all ED visits; the city's population was 435,825 in 2006. As shown in Table 1, we found significant increasing trends in dental complaint visits during the six-year period as a proportion of total ED visits, from 13.1% to 19.0% (p<0.01). During the same time period, the number of visits for non-dental complaints remained steady. More than half of dental-related (53.9%) and non-dental-related (54.8%) ED visits were made by women. There were significant differences in the patterns of the visits by age group for dental and non-dental complaints. Half of the dental visits (50.8%) were made by young adults 19–35 years of age, while this age group comprised 32.2% of the visits for non-dental complaints.
Table 1.
Characteristics of ED visits for dental care in Kansas City, Missouri, 2001–2006
ap<0.05 between dental-complaint visits and other ED visits
ED = emergency department
The very young (aged 0–6 years) and those ≥51 years of age made significantly more visits for non-dental complaints. Black people accounted for 43.8% of ED visits for dental complaints and were significantly more likely to use the ED for dental complaints than for other complaints. Injuries accounted for only 8.7% of the dental ED visits, compared with 27.8% of all non-dental ED visits. ED visits for dental care occurred more often on weekends than on weekdays; in contrast, non-dental ED visits did not show variation by day of the week.
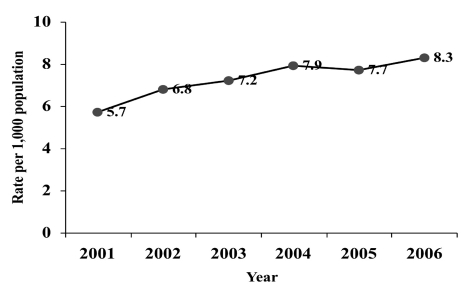
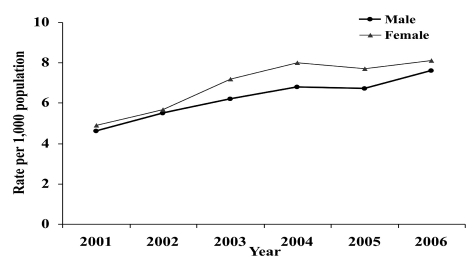
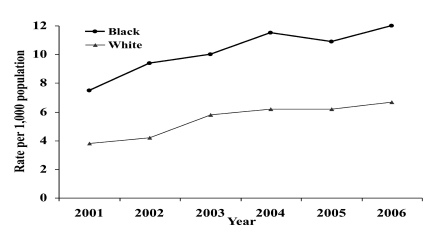
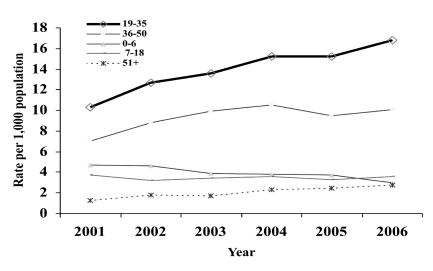
As shown inFigure 1a, there was also a significant increase in dental complaint visits during 2001–2006, from 5.7 visits per 1,000 population to 8.3 visits per 1,000 population (p<0.01). The trends increased for both males and females (Figure 1b), for non-Hispanic white and non-Hispanic black people (Figure 1c), and for those aged 19–35 years and ≥51 years (Figure 1d). However, we observed a significant decreasing trend for those aged 0–6 years (Figure 1d).
Figure 1a.
Dental-complaint rate due to emergency department visits by year, Kansas City, Missouri, 2001–2006a
aTrend analysis: R2=0.858, p<0.01
Figure 1b.
Dental-complaint rate due to emergency department visits by year and gender, Kansas City, Missouri, 2001–2006a
aTrend analysis for males: R2=0.803, p<0.01; for females: R2=0.923, p<0.01
Figure 1c.
Dental-complaint rate due to emergency department visits by year and race, Kansas City, Missouri, 2001–2006a
aTrend analysis for white people: R2=0.850, p<0.01; for black people: R2=0.833, p<0.01
Figure 1d.
Dental-complaint rate due to emergency department visits by year and age group, Kansas City, Missouri, 2001–2006a
aTrend analysis for 0–6 years of age: R2=0.905, p<0.01; for 7–18 years of age: R2=0.104, p>0.05; for 19–35 years of age: R2=0.927, p<0.01; for 36–50 years of age: R2=0.488, p>0.05; and for ≥51 years of age: R2=0.931, p<0.01
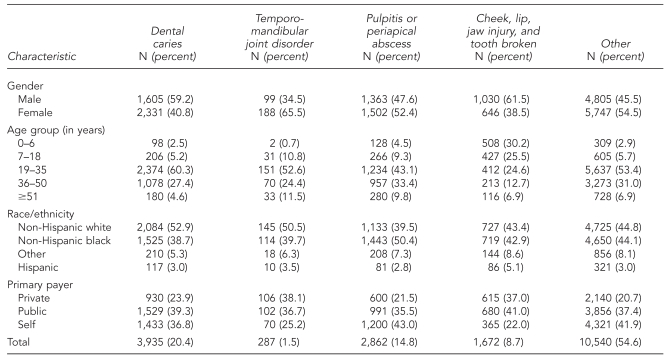
The causes of dental complaints included dental caries (20.4%), pulpitis or periapical abscess (14.8%), dental injury (8.7%), TMJ disorders (1.5%), and all other dental diseases unspecified (54.6%) (Table 2). The relationship of the causes of ED visits for dental care with gender, age group, race/ethnicity, and insurance status are shown in Table 2. During the six-year period, more males than females visited the ED for dental caries and dental injuries, children were more likely to visit the ED for dental injuries than other age groups, younger adults were more likely to visit the ED for dental caries than other age groups, and adults ≥51 years of age were less likely than other age groups to visit the ED for TMJ disorders (Table 2).
Table 2.
Characteristics of five diagnostic categories of emergency department visits for dental care in Kansas City, Missouri, 2001–2006
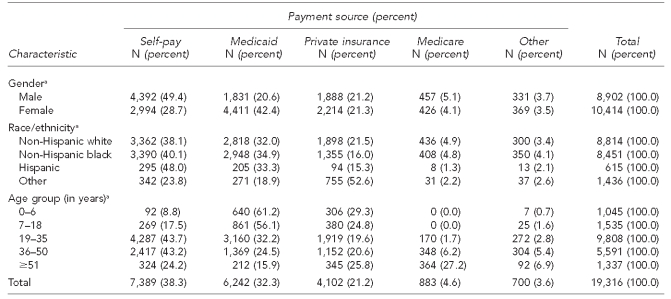
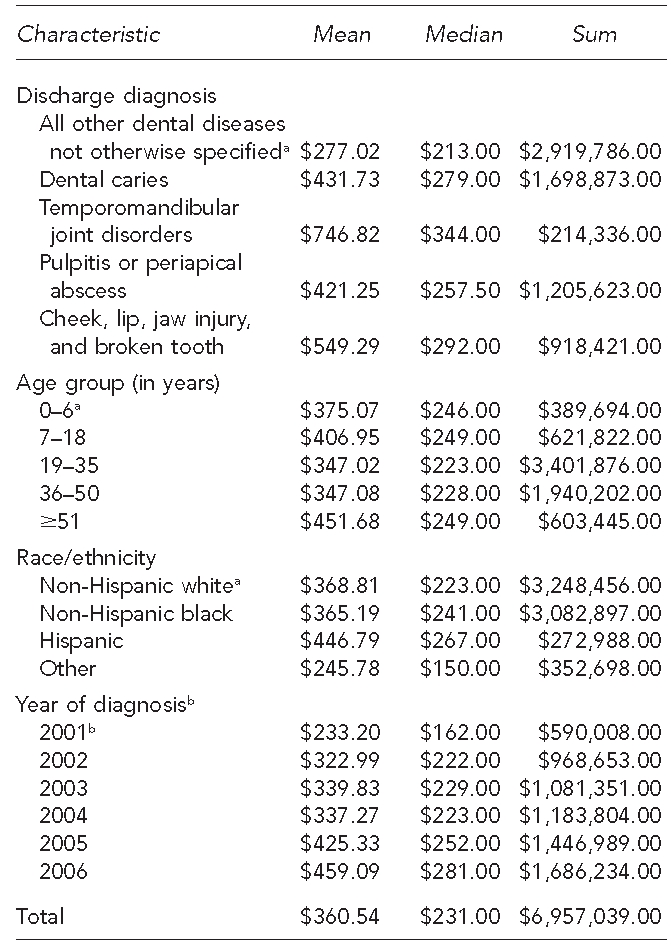
Total charges for ED visits for dental complaints were $6.9 million during the six-year period. The mean charge per ED visit was approximately $360, with a median charge of $231 (Table 3). We found significant increasing trends in both the mean and median charges per ED visit for dental care during 2001–2006 (p<0.01). The mean charges were highest for TMJ disorders ($747) and lowest for unspecified other dental diseases ($277). The mean charges were also significantly higher for people ≥51 years of age and for Hispanic people (p<0.05). Self-pay and Medicaid together constituted 76.8% of the payment sources for dental complaint visits, but only 62.8% for non-dental ED visits (Table 1). The percentage of self-pay was significantly higher for males (49.4%) than for females (28.7%), for people aged 19–35 years (43.7%) and 36–50 years (43.2%) than for other age groups, and for Hispanic people (48.0%) vs. non-Hispanic people (range: 23.8% to 40.1%) (Table 4).
Table 3.
Cost of emergency department visits for dental care in Kansas City, Missouri, 2001–2006
aReference group
bTrend analysis was p<0.01, indicating a significant increase in mean and median cost for emergency department visits for dental care during 2001–2006.
Table 4.
Percentage of emergency department visits due to dental complaints by payment source, Kansas City, Missouri, 2001–2006
ap<0.05 indicates a significantly higher rate of self-pay for males, Hispanic people, and those aged 19–50 years.
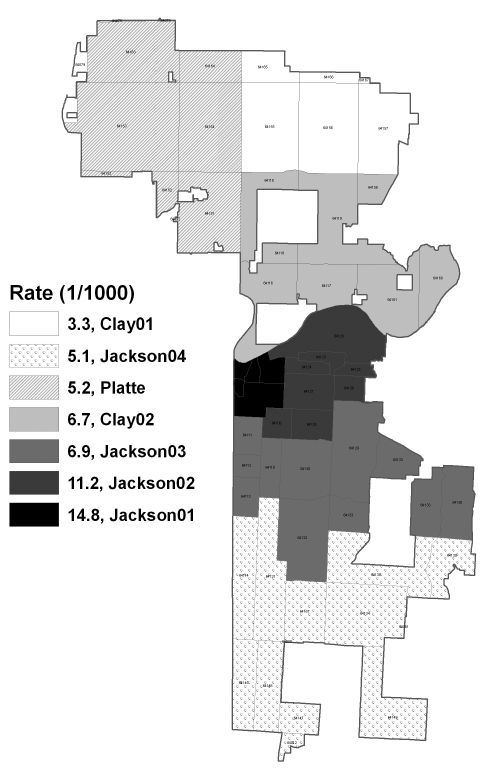
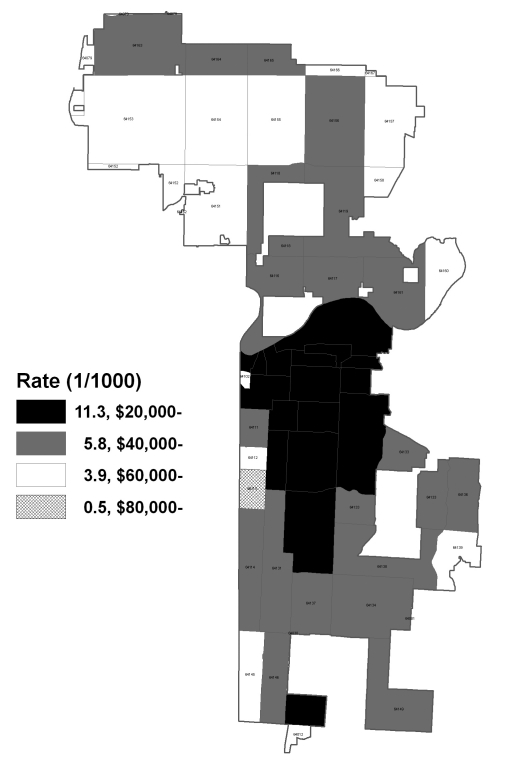
We found a significant inverse relationship between ED visits for dental care and community health and household income levels (Figures 2a and 2b). Residents from the central portion of KCMO, which has overall lower health indicators11 and household incomes, were significantly more likely than residents from other KCMO areas to visit an ED due to dental complaints. The rate of ED visits for dental care from residents in ZIP codes with a mean annual family income ≥$80,000 was 0.5 visits per 1,000 population, while the corresponding visit rate was 11.3 per 1,000 population for ZIP codes with annual family income <$40,000.
Figure 2a.
Emergency department visit rates for dental care by health community zone, Kansas City, Missouri, 2001–2006
Source: Kansas City Health Department
Figure 2b.
Emergency department visit rates for dental care by income,a Kansas City, Missouri, 2001–2006
Source: Kansas City Health Department
aMedian family income
Multivariable logistic regression analysis results (Table 5) indicated that the adjusted odds for ED visits for dental care were significantly increased for self-payers, nonwhite people, adults aged 19–50 years, people with lower family incomes, and those who visited the ED on weekends. For example, after adjusting for age, race/ethnicity, family income, and day of week, self-payers were 2.32 times more likely to visit a hospital ED for dental care than those with private medical insurance, while those with public medical insurance were 1.71 times more likely to visit an ED for dental care than those with private medical insurance. There were no significant interactions between any two variables of age group, race/ethnicity, insurance status, median family income, and day of week.
Table 5.
Logistic regression analysis for emergency department visits for dental complaints in Kansas City, Missouri, 2001–2006
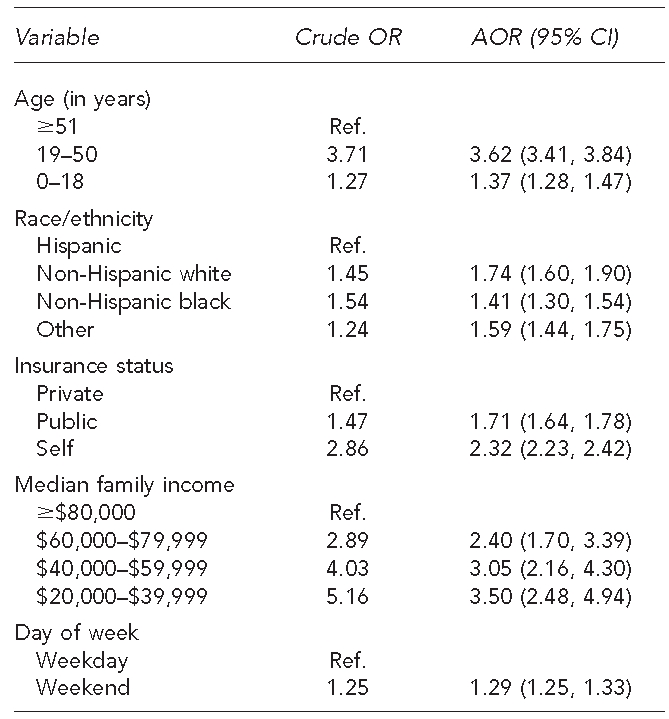
OR = odds ratio
AOR = adjusted odds ratio
CI = confidence interval
Ref. = referent group
DISCUSSION
The ED is a well-recognized entry point into the health-care system for disadvantaged patients, and in KCMO, the ED is a common site for people with dental problems to seek care. This finding is consistent with other reports in the literature.2,7,12,13 Dental-related complaints represent a significant portion of ED visits because of the ED's 24-hour availability and/or patients' lack of access to regular dental care.14,15
About 1.7% of all ED visits in KCMO were related to dental complaints, which was higher than the 0.7% reported from an analysis of the 1997–2000 National Hospital Ambulatory Medical Care Survey data.7 The causes of ED visits for dental care were mostly related to pain and/or infection. Dental injuries accounted only for about 8.7% of ED visits for dental care and occurred more often on weekends. Adults aged 19–50 years were more likely than other age groups to use the ED for dental care and accounted for 80% of such visits.
There was a significant increase in both the percentage and rate of ED visits for dental care during 2001–2006 for both males and females and for white and black people. To our knowledge, there is no such longitudinal analysis in the United States with which to compare these trends. The underlying causes for the increasing trends are unknown. However, these trends reflect the burden of oral diseases and confirm a growing oral health crisis as reported in the Surgeon General's oral health report.1 It is interesting to note that young adults were the most frequent users of EDs for dental care (50.8%), had the most significant trend increase, and had the highest percentage of self-pay (43.7%, with a mean of $347 per visit). In contrast, this age group accounted for only 32.2% of all other ED visits. This finding suggests that young adults face more serious challenges in accessing regular dental care.
It has been suggested that the most important reason for the ED serving as a safety net for primary dental care is the poor reimbursement to dental practices by Medicaid.5,16,17 In KCMO, Medicaid was second only to self-pay as the insurance status of individuals making dental-related ED visits. Therefore, many patients were on Medicaid and it is possible that these patients were not able to access dental care due to lack of providers or lack of providers who accepted Medicaid reimbursement. Improved Medicaid reimbursement, together with other measures such as expansion of dental provider hours, could possibly decrease ED visits for dental care and improve the health of patients.
The characteristics associated with ED visits for dental care identified in this study (i.e., young adults, no insurance, being from less healthy communities, and having a low family income) are also the characteristics of individuals who often experience higher levels of dental disease and face financial, cultural, social, and other system-level barriers to dental care access. Among those who experience dental problems outside of the traditional office-based dental delivery system, low-income individuals are more likely not to seek any formal treatment than middle- or high-income individuals.18 Access barriers and the role of non-dentist health-care providers outside of traditional office-based dental care delivery systems in providing preventive dental care services should be explored further.
Cost analysis associated with ED visits for dental care has also been very limited.19,20 Therefore, this study provides important information regarding the cost of such visits. Our study found a mean charge of $360 per visit, with a median charge of $231. The aforementioned study reported a median charge of $660 for an ED visit for a preventable dental condition (median reimbursement rate = $172). In both instances, the costs were much higher compared with what it generally costs to seek care in dental offices. For example, in general dental practices, costs for a periodic or comprehensive oral examination average only $41 and $60, respectively.21 As demonstrated by this study and others, ED visits for dental conditions often lead to costly treatments typically providing only pain relief and/or infection control through medications.7,19
In the U.S., dental care is financed primarily through public and private insurance, as well as out-of-pocket (self-pay) reimbursement. In Kansas City, self-pay (38.3%) was the largest payment source for dental-related ED visits, followed by Medicaid (32.3%). These findings were fairly consistent with those of Lewis et al.7 (34.8% self-pay vs. 23.7% Medicaid) and a study conducted in California (30% self-pay vs. 32% Medicaid).21 Results from the analysis of Medical Expenditure Panel Survey data indicated that 44% of the U.S. population made at least one visit to a dental office in 2004, with a mean expense of $560 per year. Approximately 35% (152 million people) did not have dental insurance, and only 27% of the uninsured made a dental visit in 2004 (in comparison, 15%, or 46.3 million people, did not have medical insurance in 2008).22 The 1994 National Access to Care Survey also found that 22.6% of the uninsured reported unmet dental needs, compared with 5.9% of those with private insurance.23 Therefore, insurance status appears to have an important impact on the use of EDs for a dental condition.24
Strengths and limitations
This study had several strengths compared with previous studies. Use of multiple-year data from all ED facilities of the focus area allowed a trend analysis for the entire KCMO region. Also, this study provided detailed information on payment sources and costs associated with ED visits for dental complaints.
However, this study also had several limitations. First, our study used local data from a much-defined geographic area and cannot be considered nationally representative. Therefore, the study results may not be generalizable to other areas/populations in the U.S. We also did not have information on several important demographic variables, such as the patients' education, occupation, employment status, marital status, and dental insurance status. These factors may have had an important impact on the number of ED visits for dental complaints. We used a community-level measure of income and, therefore, variation in individual income—which is likely to play a significant role in the decision to seek dental care at the ED—was not captured in our findings.
There was also a potential for misclassification bias. Moreover, information on the type of antibiotics and analgesics prescribed and hospitalization after the ED visits was not clear. Patient-specific identifiers were not provided, so it was not possible to determine whether an individual had more than one visit for a dental complaint during the data-collection period. Furthermore, about half of the dental diagnoses were “unspecified,” possibly due to the fact that the ED physicians were not well trained in diagnosing and treating urgent dental conditions.
CONCLUSIONS
We found that EDs are an important site for people with dental problems to seek dental care, particularly for individuals who are self-pay and have public insurance, such as Medicaid. Such visits often lead to costly emergency treatment. Other characteristics such as nonwhite race/ethnicity, age (e.g., adults), lower family income, and weekends were associated with increased use of ED visits for dental complaints. Future studies are needed to better understand the patterns and risk factors for such visits and strategies to improve access to and quality of dental care delivered in hospital emergency care settings.
Footnotes
This study was supported in part by Reach Healthcare Foundation.
REFERENCES
- 1.Satcher D Department of Health and Human Services, Office of the Surgeon General (US) Oral health in America: a report of the Surgeon General. 2000. May, [cited 2009 Aug 12]. Also available from: URL: http://www.surgeongeneral.gov/library/oralhealth.
- 2.Waldrop RD, Ho B, Reed S. Increasing frequency of dental patients in the urban ED. Am J Emerg Med. 2000;18:687–9. doi: 10.1053/ajem.2000.7333. [DOI] [PubMed] [Google Scholar]
- 3.Wilson S, Smith GA, Preisch J, Casamassimo PS. Nontraumatic dental emergencies in a pediatric emergency department. Clin Pediatr (Phila) 1997;36:333–7. doi: 10.1177/000992289703600604. [DOI] [PubMed] [Google Scholar]
- 4.Von Kaenel D, Vitangeli D, Casamassimo PS, Wilson S, Preisch J. Social factors associated with pediatric emergency department visits for caries-related dental pain. Pediatr Dent. 2001;23:56–60. [PubMed] [Google Scholar]
- 5.Dorfman DH, Kastner B, Vinci RJ. Dental concerns unrelated to trauma in the pediatric emergency department. Arch Pediatr Adolesc Med. 2001;155:699–703. doi: 10.1001/archpedi.155.6.699. [DOI] [PubMed] [Google Scholar]
- 6.Sheller B, Williams BJ, Lombardi SM. Diagnosis and treatment of dental caries-related emergencies in a children's hospital. Pediatr Dent. 1997;19:470–5. [PubMed] [Google Scholar]
- 7.Lewis C, Lynch H, Johnston B. Dental complaints in emergency departments: a national perspective. Ann Emerg Med. 2003;42:93–9. doi: 10.1067/mem.2003.234. [DOI] [PubMed] [Google Scholar]
- 8.Zeng Y, Sheller B, Milgrom P. Epidemiology of dental emergency visits to an urban children's hospital. Pediatric Dent. 1994;16:419–23. [PubMed] [Google Scholar]
- 9.Manski RJ, Cohen LA, Hooper FJ. Use of hospital emergency rooms for dental care. Gen Dent. 1998;46:44–7. [PubMed] [Google Scholar]
- 10.SPSS, Inc. SPSS®: Version 15.0 for Windows. Chicago: SPSS, Inc.; 2006. [Google Scholar]
- 11.Hoff G, Cai J. Kansas City community health report 2008. Kansas City (MO): Department of Health Office of Epidemiology; 2008. [cited 2009 Aug 12]. Also available from: URL: http://ww4.kcmo.org/health/pdf/2008CHA/Community_Health_Assessment_2008_full_report.pdf. [Google Scholar]
- 12.Bringhurst C, Herr RD, Aldous JA. Oral trauma in the emergency department. Am J Emerg Med. 1993;11:486–90. doi: 10.1016/0735-6757(93)90091-o. [DOI] [PubMed] [Google Scholar]
- 13.Gibson DE, Verono AA. Dentistry in the emergency department. J Emerg Med. 1987;5:35–44. doi: 10.1016/0736-4679(87)90008-4. [DOI] [PubMed] [Google Scholar]
- 14.Cohen E, Healey J, Scapicchio A. Medicolegal considerations of emergency medical care. In: May HL, editor. Emergency medicine. New York: John Wiley – Sons; 1984. pp. p. 883–8. [Google Scholar]
- 15.Sonis ST, Valachovic RW. An analysis of dental services based in the emergency room. Spec Care Dent. 1988;8:106–8. doi: 10.1111/j.1754-4505.1988.tb00708.x. [DOI] [PubMed] [Google Scholar]
- 16.Waldman HB. Mid-1990s review of Medicaid and Medicaid dentistry. ASDC J Dent Child. 1997;64:141–8. [PubMed] [Google Scholar]
- 17.Cohen LA, Magder LS, Manski RJ, Mullins CD. Hospital admissions associated with nontraumatic dental emergencies in a Medicaid population. Am J Emerg Med. 2003;21:540–4. doi: 10.1016/j.ajem.2003.08.013. [DOI] [PubMed] [Google Scholar]
- 18.Cohen LA, Manski RJ. Visits to non-dentist health care providers for dental problems. Fam Med. 2006;38:556–64. [PubMed] [Google Scholar]
- 19.Mullins CD, Cohen LA, Magder LS, Manski RJ. Medicaid coverage and utilization of adult dental services. J Health Care Poor Underserved. 2004;15:672–87. doi: 10.1353/hpu.2004.0068. [DOI] [PubMed] [Google Scholar]
- 20.Simonson Maiuro L. Emergency department visits for preventable dental conditions in California. Oakland (CA): California Healthcare Foundation; 2009. [cited 2009 Aug 15]. Also available from: URL: http://www.chcf.org/documents/policy/EDUseDentalConditions.pdf. [Google Scholar]
- 21.American Dental Association. Survey of general practice fees. Chicago: American Dental Association; 2005. [Google Scholar]
- 22.Manski RJ, Brown E., Jr . Medical Expenditure Panel Survey (MEPS) chartbook no.17: dental use, expenses, private dental coverage, and changes, 1996 and 2004. Rockville (MD): Agency for Healthcare Research and Quality (US); 2007. [cited 2009 Aug 15]. Also available from: URL: http://www.meps.ahrq.gov/mepsweb/data_files/publications/cb17/cb17.pdf. [Google Scholar]
- 23.Mueller CD, Schur CL, Paramore LC. Access to dental care in the United States. J Am Dent Assoc. 1998;129:429–37. doi: 10.14219/jada.archive.1998.0241. [DOI] [PubMed] [Google Scholar]
- 24.Cohen LA, Manski RJ, Hooper FJ. Does the elimination of Medicaid reimbursement affect the frequency of emergency department dental visits? J Am Dent Assoc. 1996;127:605–9. doi: 10.14219/jada.archive.1996.0272. [DOI] [PubMed] [Google Scholar]


