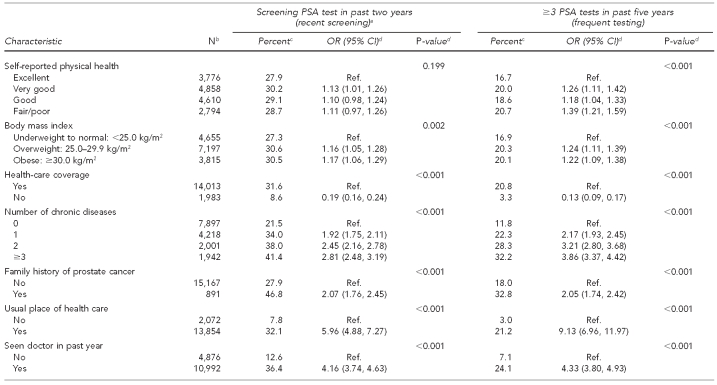
Table 1.
PSA test use among men ≥40 years of age with no prostate cancer (n=16,058), by demographic and health characteristics: NHIS 2000 and 2005
aScreening PSA test indicates that the reason for most recent PSA test within two years was routine screening.
bNumbers that do not add up to total indicate missing values.
cPercentages are weighted to reflect the entire population.
dUnadjusted ORs and p-values obtained from logistic regression using non-missing values. P-values compare percentages within levels of each category.
eIncome level of <$35,000 includes those who reported income as ≥$20,000.
PSA = prostate-specific antigen
NHIS = National Health Interview Survey
OR = odds ratio
CI = confidence interval
Ref. = referent group
kg/m2 = kilograms/meter squared


