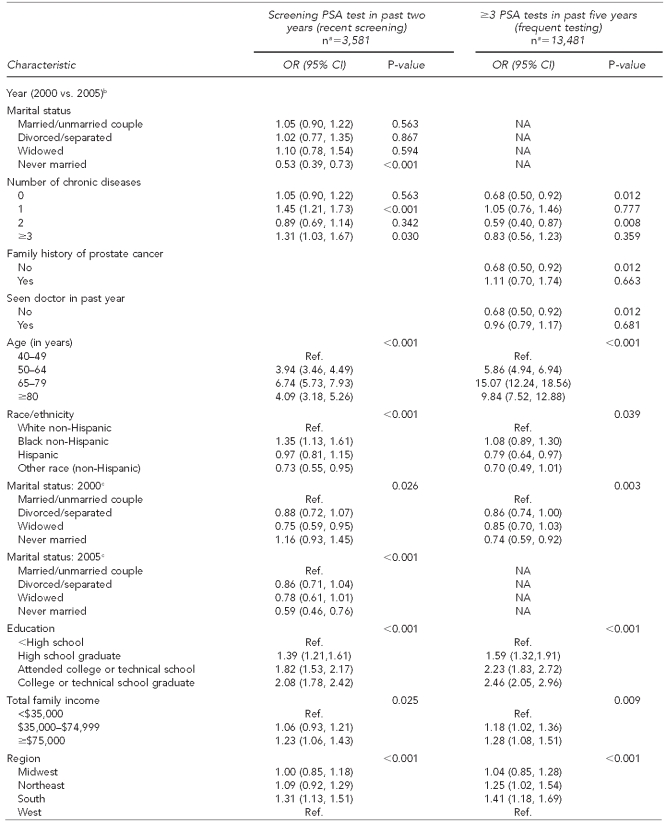
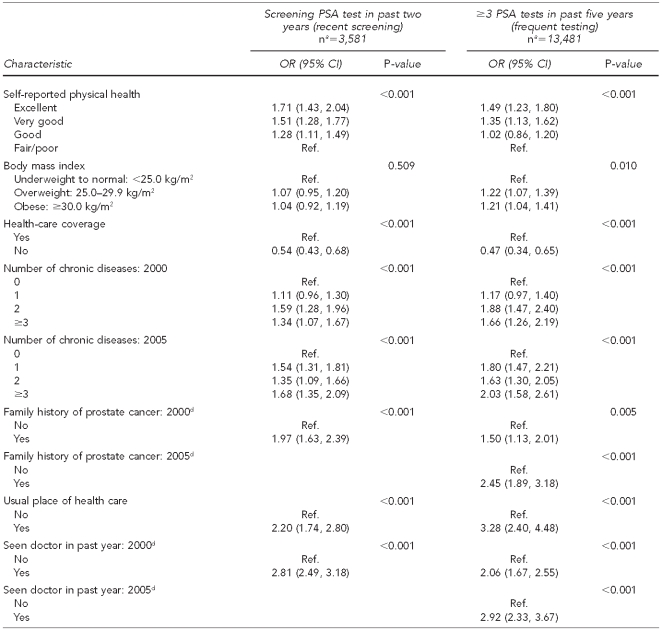
Table 3.
Multivariate logistic regression model of PSA test use among men ≥40 years of age with no prostate cancer, NHIS 2000 and 2005
aUnweighted
bNo significant interactions with year for family history of prostate cancer and having seen a doctor in the past year for recent-screening outcome; no significant interactions with year for marital status for frequent-testing outcome
cORs for marital status for receipt of ≥3 PSA tests in the past five years were the same for 2000 and 2005; no significant interaction.
dORs for family history of prostate cancer and seen doctor in the past year for receipt of a screening PSA test in the past two years were the same for 2000 and 2005; no significant interaction.
PSA = prostate-specific antigen
NHIS = National Health Interview Survey
OR = odds ratio
CI = confidence interval
NA = not applicable
kg/m2 = kilograms/meter squared
Ref. = reference group


