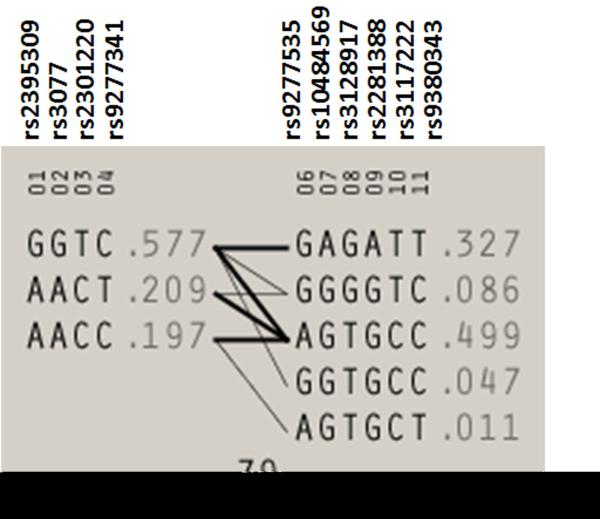
Figure 2.
Markers are shown across the top. Population frequencies are shown next to each haplotype and lines show the most common crossings from one block to the next, with thicker lines showing more common crossings than thinner lines. Shown beneath the crossing lines is multilocus D prime, which is a measure of the LD between two blocks.

