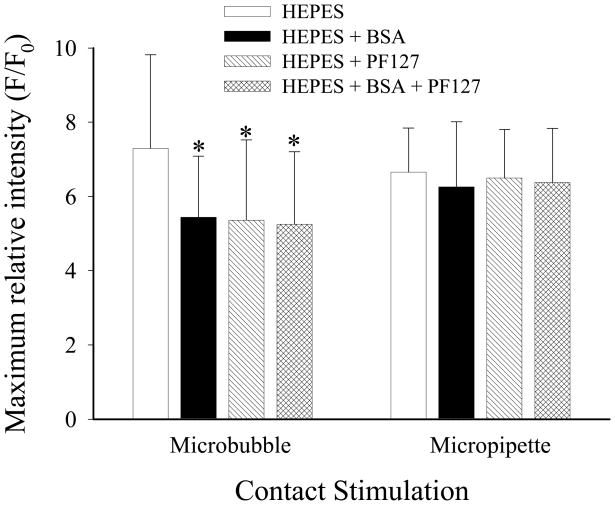
Figure 5.
Maximum relative fluorescence intensity for endothelial cell calcium signaling following microbubble or micropipette contact in plain HEPES buffer and buffer with BSA, PF-127 or both added (n = 24 per group). * P < 0.05 compared to maximum relative fluorescence intensity following stimulation of cells in plain buffer.

