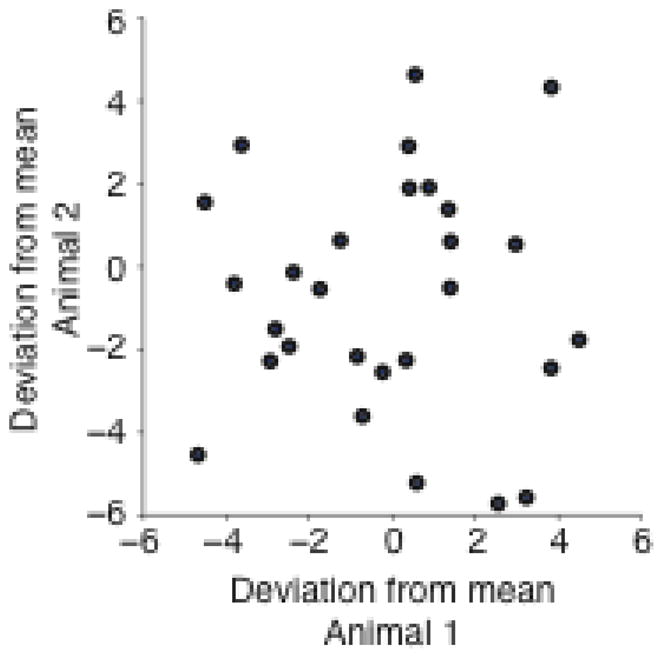
Figure 7.

Correlation between threshold changes for paired-animal experiments. Each point compares the change in threshold on a particular day for a given rat and its yoked partner. The daily change in threshold is shown after subtracting the average change for the corresponding stimulus state.
