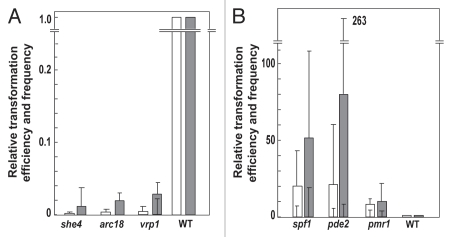
Figure 1.
Relative transformation efficiency (white bar) and frequency (grey bar) of the low-transformability mutants (A) and high-transformability mutants (B).35 The values are relative to those of the WT (BY4742), set at 1.0. The averages and minimum or maximum of 3 independent experiments are shown.

