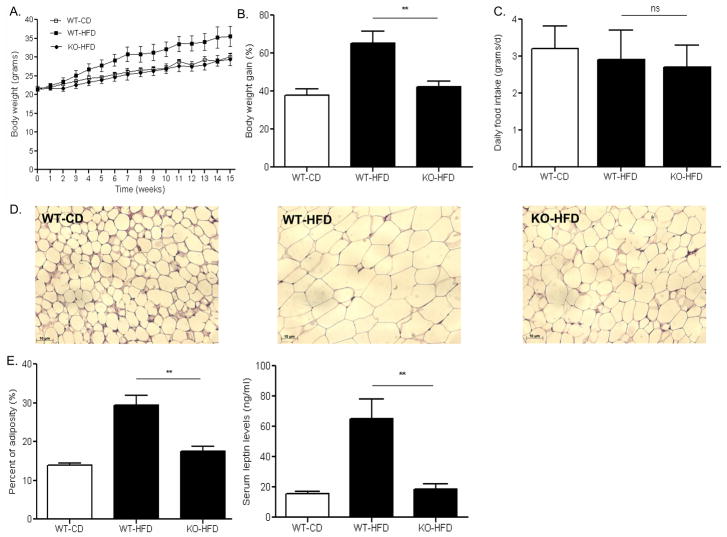
Figure 1. Body weight, food intake and adiposity in mice fed a high fat diet.
(WT: wild type; KO: MCH−/−; HFD: high fat diet; CD: control diet). (A) Body weight in MCH −/− mice (KO-HFD) was significantly lower than that in WT mice fed the same diet (WT-HFD). (B) Body weight gain during the study expressed as % of initial body weight. (C) Average daily food intake in the three groups of mice. (D) Representative sections of epididymal fat tissue from the three different groups of mice. (E) MCH −/− mice fed HFD exhibited significantly lower % fat mass as compared with WT mice fed a high fat diet. (F) Under high fat feeding, MCH −/− mice had significantly lower serum leptin levels as compared with WT mice fed high fat diet. **P < 0.01; ns (not significant)

