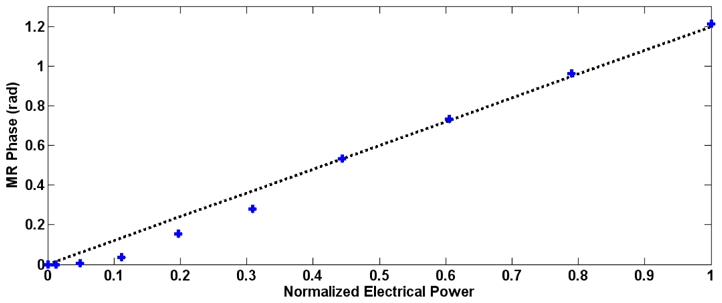
Figure 4.

Calibration curve obtained with a PDMS physical aberrator in front of the linear array. The MR phase is plotted as a function of the normalized electrical power together with the best linear fit. All subsequent acquisitions were performed at maximum power.
