
Figure 6.
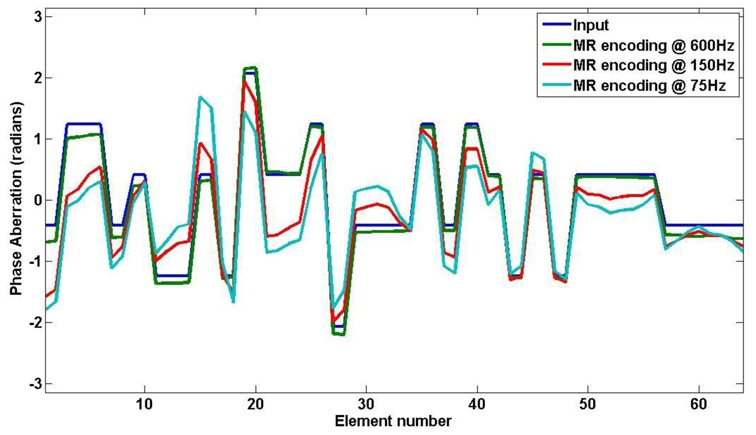
Numerical phase aberrations along the 64 elements linear array: input values (blue curve), recovered values for the simulated experiment with MSG frequency at 600Hz (green), 150Hz (red) and 75Hz (light blue).
Official websites use .gov
A
.gov website belongs to an official
government organization in the United States.
Secure .gov websites use HTTPS
A lock (
) or https:// means you've safely
connected to the .gov website. Share sensitive
information only on official, secure websites.
Numerical phase aberrations along the 64 elements linear array: input values (blue curve), recovered values for the simulated experiment with MSG frequency at 600Hz (green), 150Hz (red) and 75Hz (light blue).