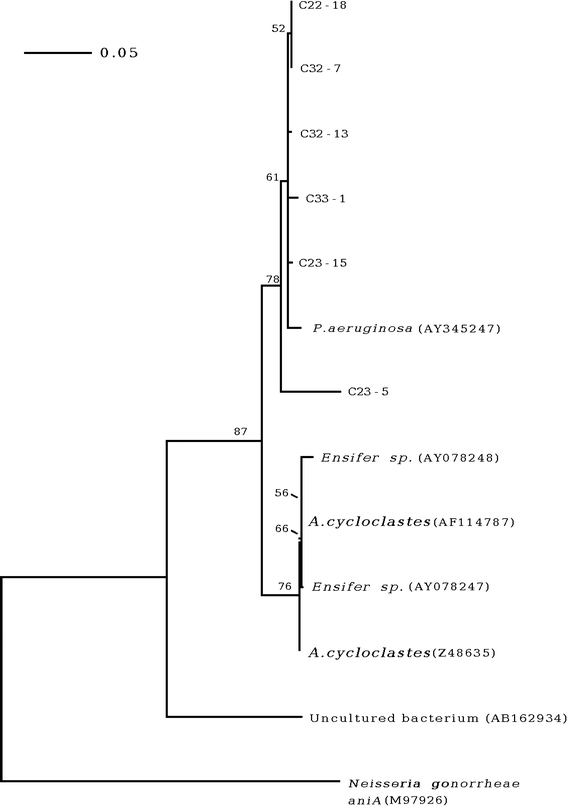
Fig. 1.

A rooted neighbor-joining phylogram of the partial nirK sequences. The scale bar indicates the expected number of changes per sequence position. For each node, bootstrap values greater than 50% are shown. The GenBank accession number is indicated in brackets after the name of the organism. The sequence of aniA from Neisseria gonorrhoeae (accession no. M97926) was used as the out group to root the phylogram
