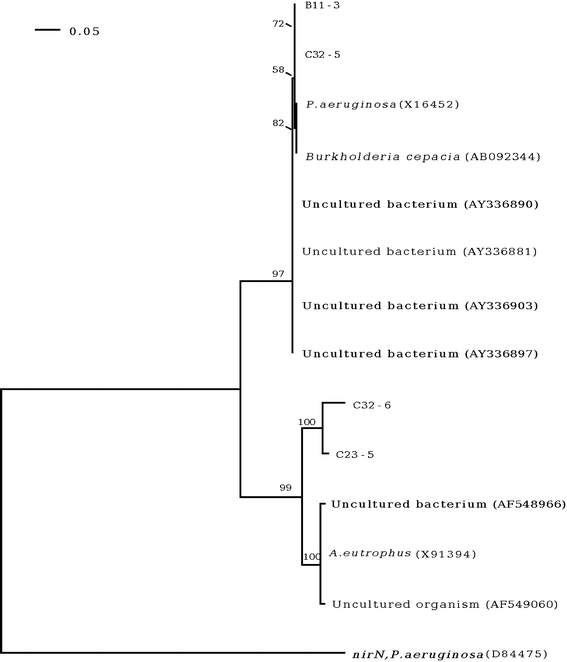
Fig. 2.

A rooted neighbor-joining phylogram of the partial nirS sequences. The scale bar indicates the expected number of changes per sequence position. For each node, bootstrap values greater than 50% are shown. The GenBank accession number is indicated in brackets after the name of the organism. The sequence of nirN from Pseudomonas aeruginosa was used as the out-group to root the phylogram
