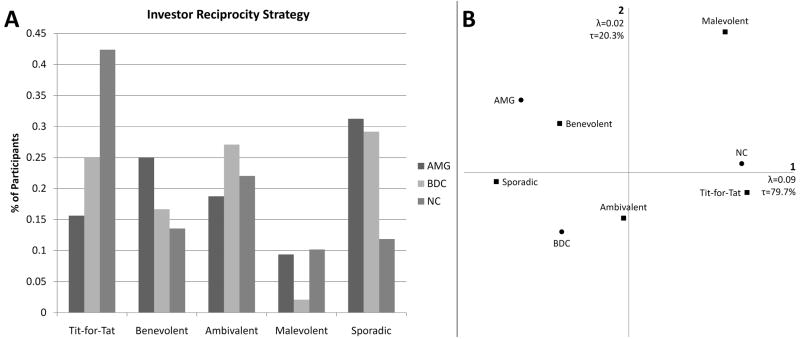
Fig. 3. Investor Reciprocity Strategy.
A. Chi-square test reveals significant differences between groups in terms of investor reciprocity strategy use (p=0.050). B. Correspondence analysis reveals a tight clustering of NCs with Tit-for-Tat strategy use, a loose relationship of BDCs somewhere between sporadic and ambivalent strategy use, and relationship between the AMG group and benevolent strategy use.

