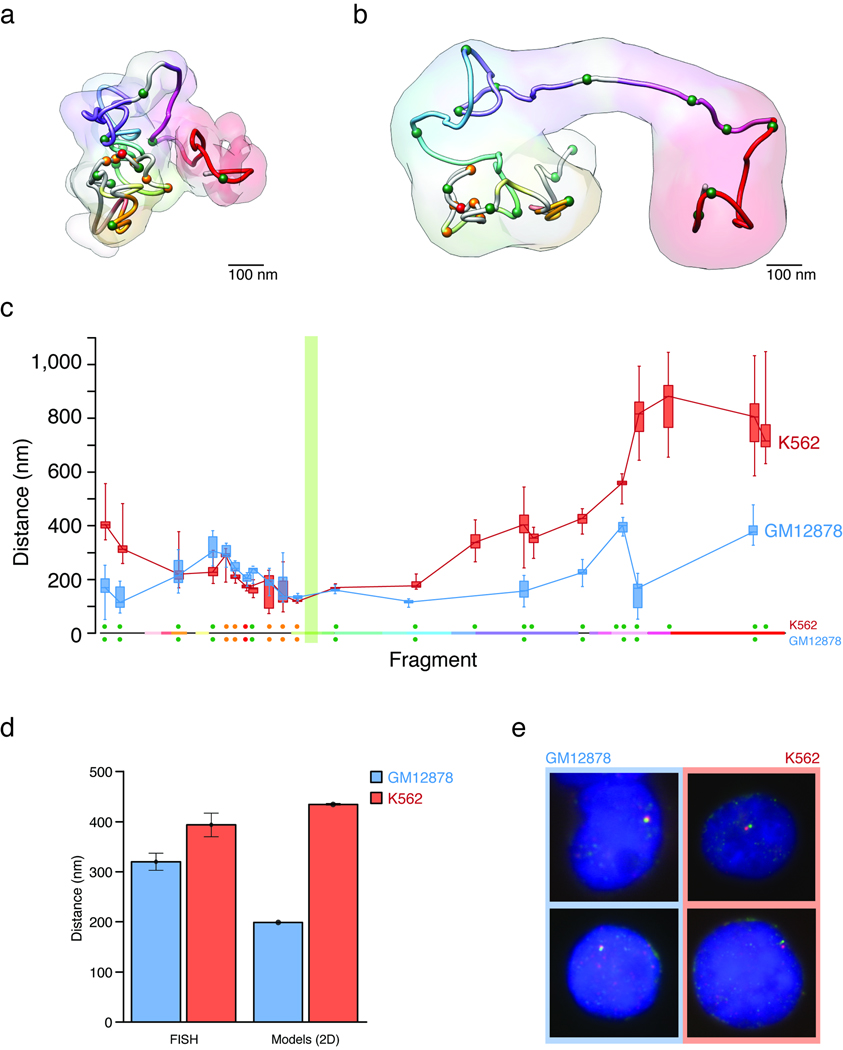
Figure 4.
3D models of the ENm008 ENCODE region containing the α-globin locus. (a) 3D structure of the GM12878 models represented by the centroid of cluster number 1. The 3D model is colored as in its linear representation (Fig. 1a). Regulatory elements are represented as spheres colored in red (HS40), orange (other HSs), and green (CTCFs). (b) 3D structure of the K562 models represented by the centroid of cluster number 2. Data are represented as in panel a. (c) Distances between the α-globin genes (restriction fragments 31–32) and other restriction fragments in ENm008. The plot shows the distribution and standard deviation of the mean of distances for GM12878 models in cluster 1 (blue) and K562 models in cluster 2 (red). (d) Average distances and their standard error between a pair of loci located on either end of the ENM008 domain as determined by FISH with two fosmid probes (see Methods) and from a 2D representation of the IMP-generated models in both cell lines. (e) Example images obtained with FISH of GM12878 and K562 cell lines. The images show smaller distances between the probes in GM12878 than in K562 cell lines.

