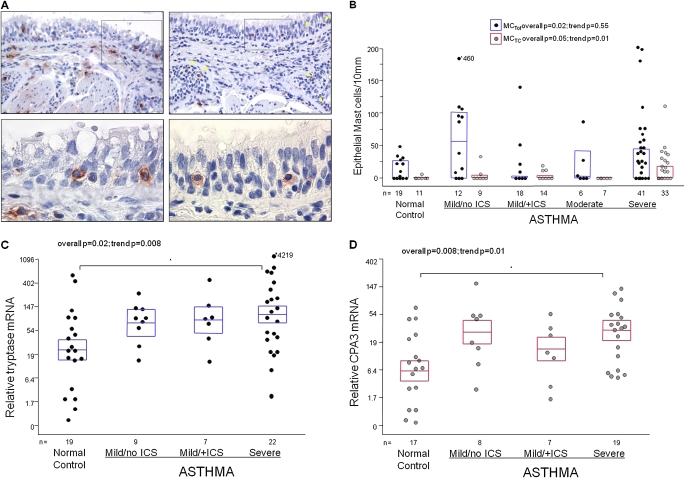
Figure 2.
(A) Immunostaining for tryptase (left panels) and chymase (right panels) in the same proximal airway region from a subject with severe asthma. Pictures in upper panels are taken at 200× magnification. Arrows (yellow) in the right upper panel point at chymase-positive epithelial mast cells. Epithelial mast cells within boxes are shown in lower panels at 600× magnification. (B) Distribution of epithelial total mast cells (MCs) (tryptase-positive MCTot; black circles/blue lines are median and 25th–75th percentiles) and chymase-positive mast cells (MCTC; gray circles/red lines are medians and 25th–75th percentiles) evaluated by immunostaining. The groups were compared using Kruskal/Wallis tests (overall P value) and Jonckheere-Terpstra tests (trend P values). (C) Relative mRNA levels for tryptase, and (D) carboxypeptidase A3 (CPA3) in airway epithelial brushings. Y-axis represents a natural log-scale of the original linear values, with the means and SEM transformed from the natural log to the linear values. The groups in C and D were compared using analysis of variance and linear trend analysis. Marked are intergroup differences that remained significant after Bonferroni correction (P ≤ 0.01). ICS = inhaled corticosteroid.

