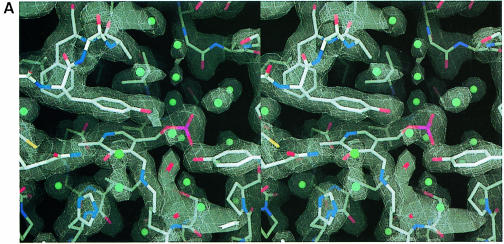
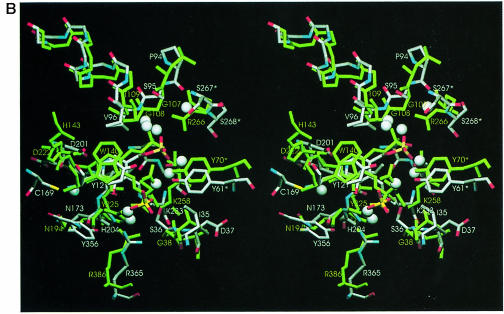
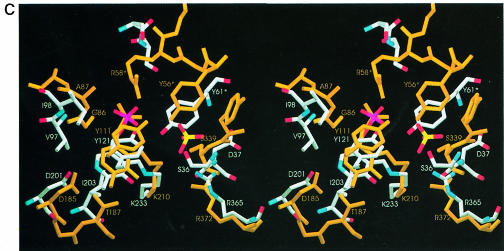
Fig. 3. Active site of MalY. (A) Stereo plot of the final electron density of the PLP cofactor and the immediate protein vicinity (colour coded by atom type). The 2Fo – Fc map is contoured at 1.1σ and calculated at 2.05 Å with the A221V reflection data. Water molecules are indicated by cyan balls. (B) Detailed comparison of the active site of MalY (colour coded by atom type) and AAT (green), resulting from a least-squares superposition as described in the text. Some important water molecules of the MalY active site are represented as grey balls. The residue labels of both structures are indicated. (C) Overlay of mechanistically important active site residues of MalY and CBL (orange). (B) and (C) were generated with SETOR (Evans, 1993), (A) and all the subsequent figures were generated with DINO.

An official website of the United States government
Here's how you know
Official websites use .gov
A
.gov website belongs to an official
government organization in the United States.
Secure .gov websites use HTTPS
A lock (
) or https:// means you've safely
connected to the .gov website. Share sensitive
information only on official, secure websites.


