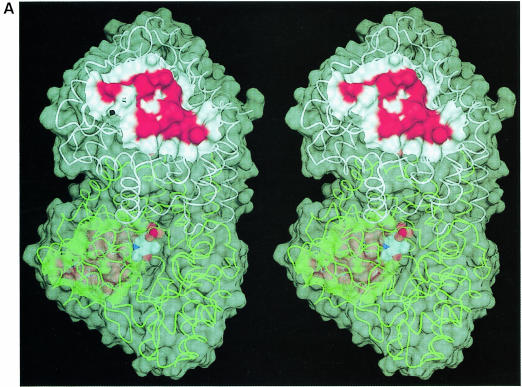
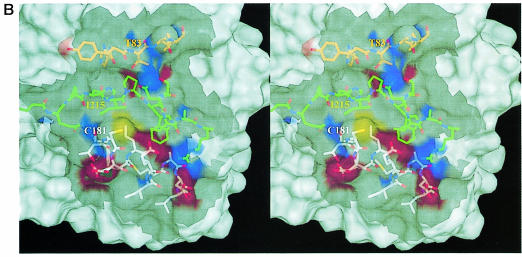
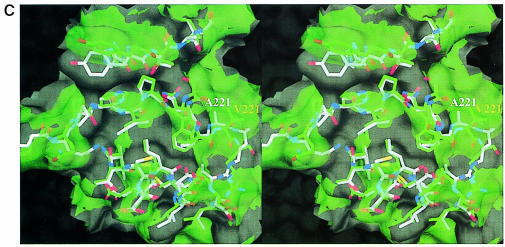
Fig. 4. MalT-binding site. (A) The active dimer of MalY illustrating the location of the MalT interaction patch. The Cα traces of both monomers (white and green) are overlaid with a transparent surface. The MalT interaction regions are emphasized by a solid surface that was defined on the basis of the negative repressor mutants (drawn in red). The PLP cofactor is shown in a van der Waals representation. Note that the MalT-binding surface and the active site entrance to the PLP cofactor are located on opposite sides of the individual MalY monomers. (B) Spatial structure of the MalT-binding patch, which is constructed from the three segments I, II and III as described in the text. The C atoms of segments I, II and III are coloured orange (residues 81–85), white (residues 179–191) and green (residues 212–222), respectively. For each segment, the most important residue regarding MalT repression (Table II) is labelled. The model is overlaid with a transparent surface that is colour coded by atom type. (C) Overlay of the wild-type and A221V MalT interaction segments I, II and III. The wild-type model and the corresponding surface are in white, the A221V mutant in green. Obviously, the mutation Ala221 to Val221 results in a concerted structural reorientation of all three segments. The orientations of (B) and (C) are identical.

An official website of the United States government
Here's how you know
Official websites use .gov
A
.gov website belongs to an official
government organization in the United States.
Secure .gov websites use HTTPS
A lock (
) or https:// means you've safely
connected to the .gov website. Share sensitive
information only on official, secure websites.


