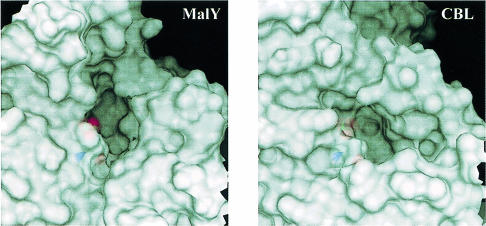
Fig. 5. Active site entrances of MalY (left) and CBL (right). The orientation and scaling of both figures are identical. The corresponding PLP cofactors are shown in a van der Waals representation below the surface. Part of the phosphate group of the MalY cofactor is directly accessible in the active site cleft.

An official website of the United States government
Here's how you know
Official websites use .gov
A
.gov website belongs to an official
government organization in the United States.
Secure .gov websites use HTTPS
A lock (
) or https:// means you've safely
connected to the .gov website. Share sensitive
information only on official, secure websites.
