Figure 1.
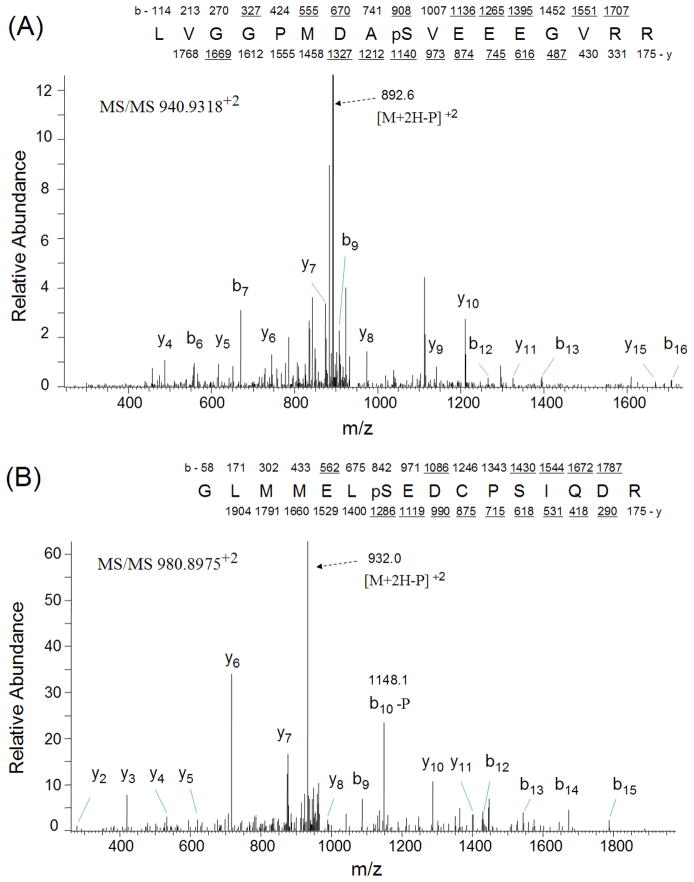
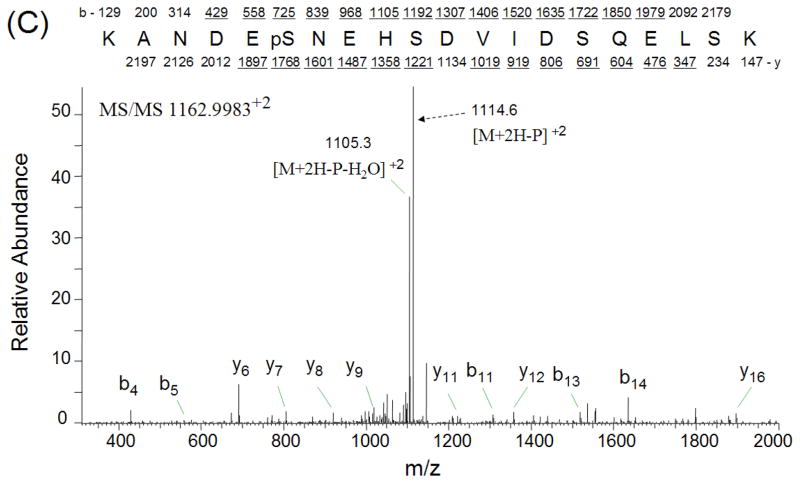
CID spectra of three phosphopeptides. CID spectra were labeled to show singly-charged b and y ions, as well as ions corresponding to neutral losses of the phosphate group and water. A) phosphopeptide LVGGPMDApSVEEEGVRR from cystatin C; B) phosphopeptide GLMMELpSEDCPSIQDR from crystallin, gamma C; C) phosphopeptide KANDEpSNEHSDVIDSQELSK from secreted phosphoprotein 1 isoform b.


