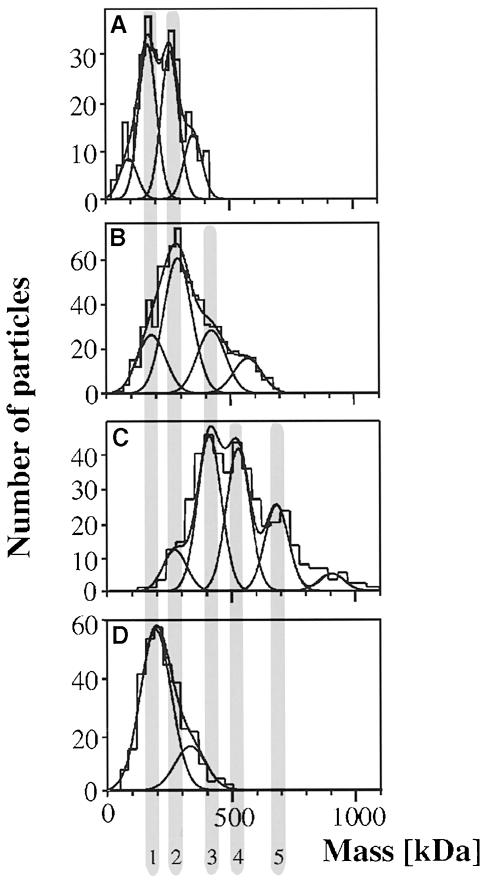
Fig. 7. Mass analysis. The scanning transmission electron microscope (STEM) allows mass analysis of heterogeneous particle mixtures. Unstained preparations prepared by freeze–drying were recorded and evaluated as described (Müller and Engel, 1998). (A) Solubilized SecYEG reveals two major peaks [at 176 (peak 1) and 268 kDa (peak 2)] and two minor peaks at the left and right sides of the histogram. (B) SecYEG after incubation with SecA and AMP–PNP demonstrates a striking shift of the particle mass. The three major peaks are centred at 183 kDa (peak 1), 289 kDa (peak 2) and 421 kDa (peak 3). The peak at 580 kDa includes ∼10% of all particles measured. (C) Sucrose gradient fractionation of solubilized proteoliposomes after the accumulation of the I31 translocation intermediate reveals a further shift towards larger complexes. The histogram includes particles larger than 10 nm. The three major peaks are centred at 416 kDa (peak 3), 531 kDa (peak 4) and 686 kDa (peak 5), with a minor peak at 276 kDa (peak 2). (D) Mass analysis of the same preparation, but of particles <10 nm. The major Gauss peak is located at 200 kDa (peak 1), the minor peak at 330 kDa (peak 2).

An official website of the United States government
Here's how you know
Official websites use .gov
A
.gov website belongs to an official
government organization in the United States.
Secure .gov websites use HTTPS
A lock (
) or https:// means you've safely
connected to the .gov website. Share sensitive
information only on official, secure websites.
