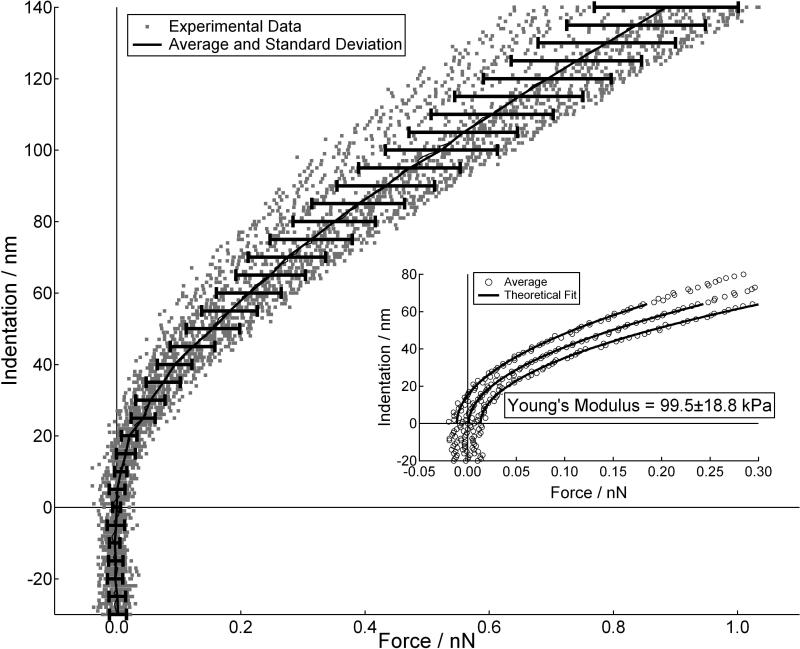
FIGURE 3.
Indentation vs. force curves measured at 5 different positions on a polyacrylamide gel. At each position 5 force curves were measured (grey dots). The average and standard deviation of these 25 curves overlays the data (black lines). The inset is a plot of the average and the positive and negative standard deviation curves. The solid lines in the inset are linear least square fits of the average and standard deviation curves, which gave a result of 99.5±18.8 kPa.

