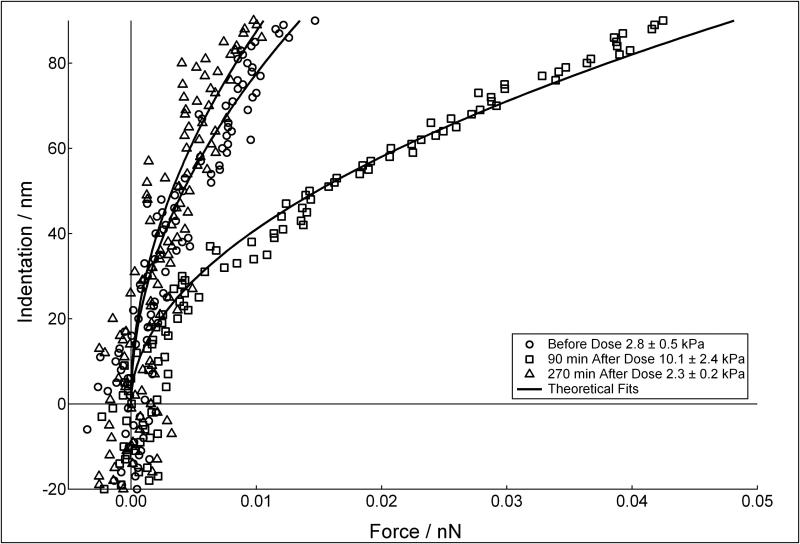
FIGURE 6.
Indentation vs. force curves measured on HTM cells on glass before dose (circles), and 90 and 270 minutes after exposure and removal of Lat-B (squares and triangles respectively). HTM cell resistance to deformation increased ~ 4 times at 90 minutes, and then decreased back to the pre-dosed cell modulus within 270 minutes of exposure.

