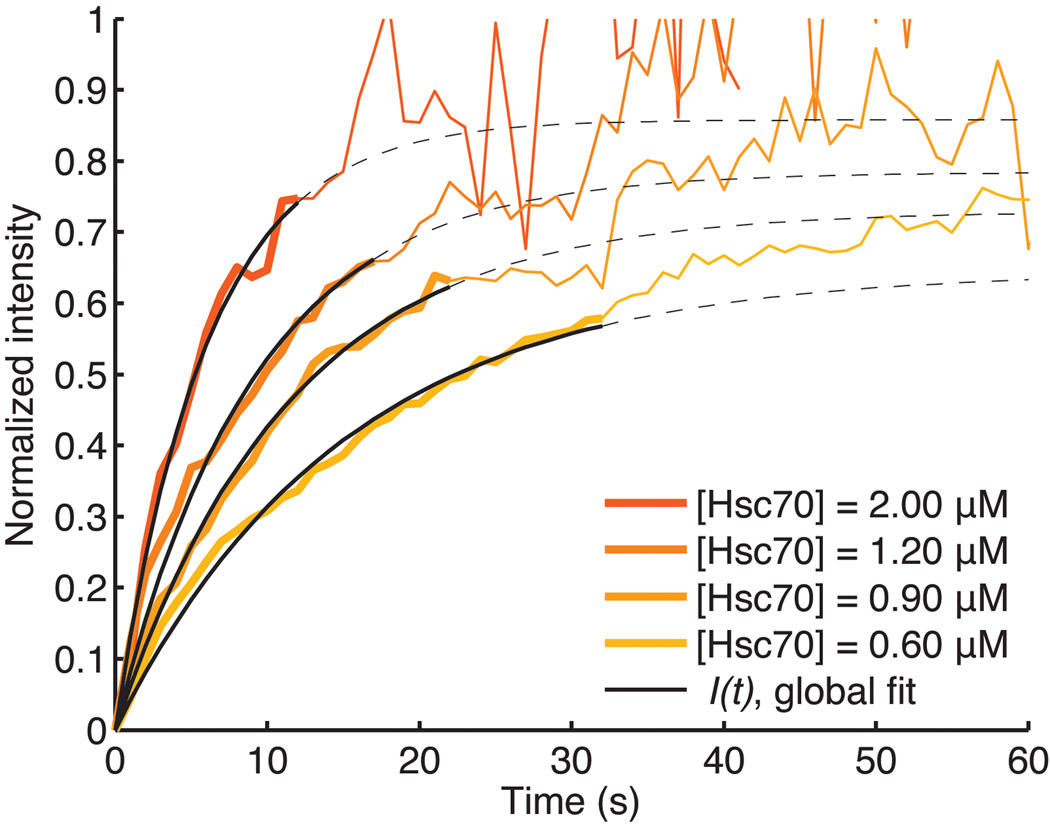
Figure 5. Recruitment of Hsc70 to clathrin/AP-2 coats during the accumulation phase follows first order kinetics.
The orange traces correspond to the averaged intensity of the Hsc70 fluorescence measurements recorded in separate, single-particle uncoating assays with various Hsc70 concentrations. We used a global fit of the accumulation phase up to the mean accumulation time for each concentration (solid line) to determine the association and dissociation rates of Hsc70 binding. Mean accumulation times are derived from the accumulation time distributions in Figure 6. During this early recruitment phase Hsc70 binds preferentially to the QLMLT sequence after activation by the neighboring auxilin J-domain. During the later stages, when most of the specific sites have been occupied, activated Hsc70 is presumably delivered to other sites, which do not drive disassembly. The average Hsc70 binding curves become noisy beyond their corresponding mean accumulation times because most coats have started to disassemble, and the average is calculated from an increasingly lower number of coats. The dotted lines show the binding curves from the calculated parameters, beyond the range of the data used for fitting.

