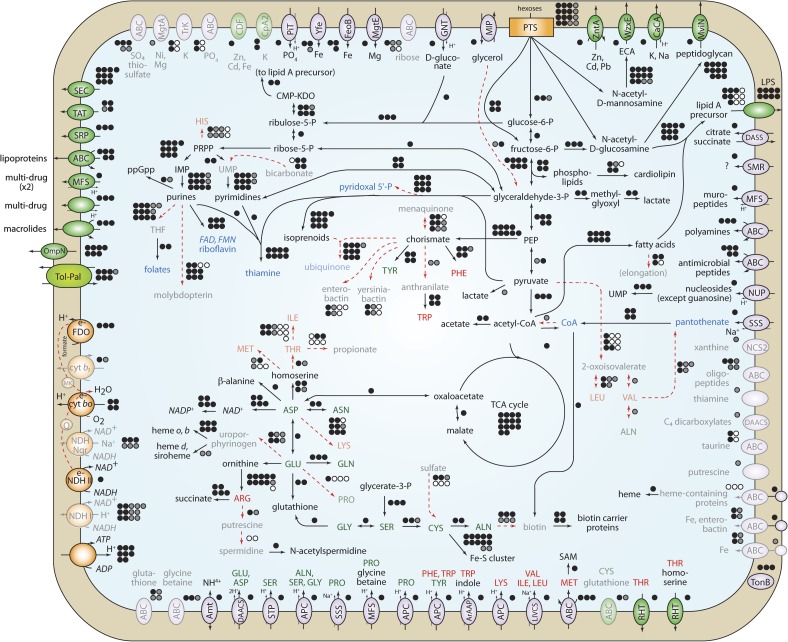
FIG. 3.
Reconstruction of Serratia symbiotica metabolism. Intact pathways are shown with black lines, and inactive pathways in red dashed lines or opaque symbols and lettering. The number of genes involved in each pathway is shown as circles next to each pathway, with black representing intact genes, gray as pseudogenes, and white as genes absent from the genome. Vitamins and cofactors are in blue lettering, and essential and nonessential amino acids for aphids are shown in red and green lettering, respectively.

