FIG. 6.
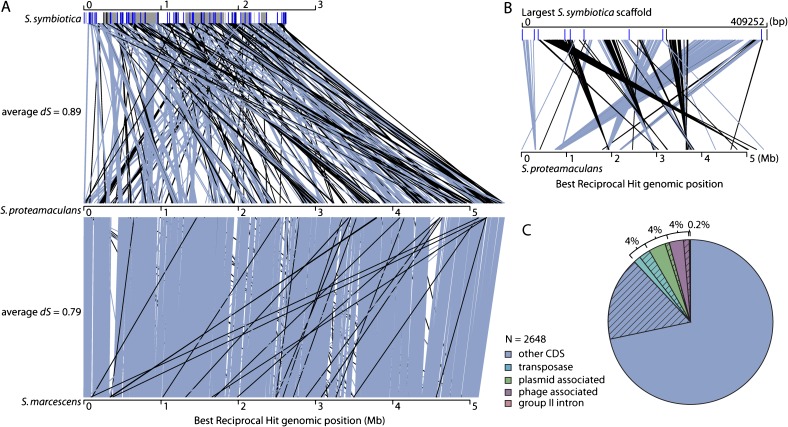
(A) Rearrangements in three Serratia genomes. Lines indicate positions of orthologous genes in each genome, with grey-blue indicating genes the same orientation on chromosomes, and black indicating the opposite orientation. The Serratia symbiotica genome is shown as alternating white and gray blocks that represent different scaffolds. Black and blue lines on these blocks indicate positions of intact and inactive transposases, respectively. (B) Rearrangements between the largest scaffold of the S. symbiotica genome and the S. proteamaculans genome. Lines are colored as for (A). Transposases often flank blocks of conserved synteny. (C) Distribution of intact genes and pseudogenes in three categories of mobile DNA in the S. symbiotica genome. Percentages indicate the proportion of genes in each category, and hashing indicates pseudogenes.

