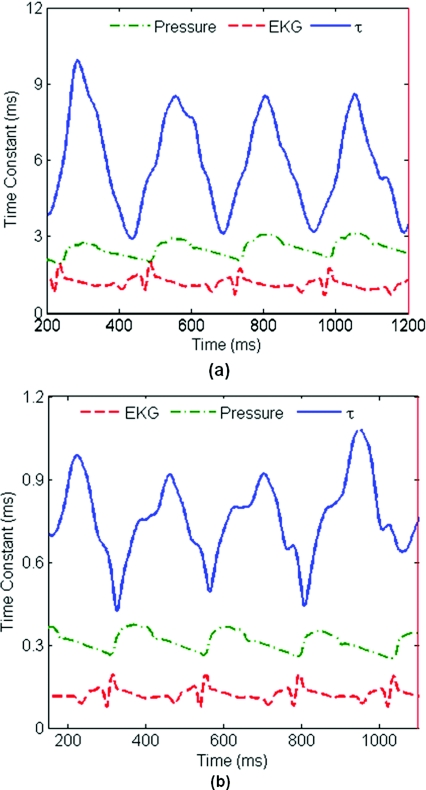
Figure 4.
In vivo rabbit studies: Time constant fluctuations (solid blue) at (a) an in-stent position, and (b) out of stent position, over ∼4 cardiac cycles. Corresponding EKG (dashed red) and pressure (dot-dashed green) signals are also shown. Time constants measured at the stented sites are an order of magnitude higher than those measured at nonstented proximal sites due to the presence of the bare metal stent struts in the FOV at the stented arterial sites.

