
Figure 1.
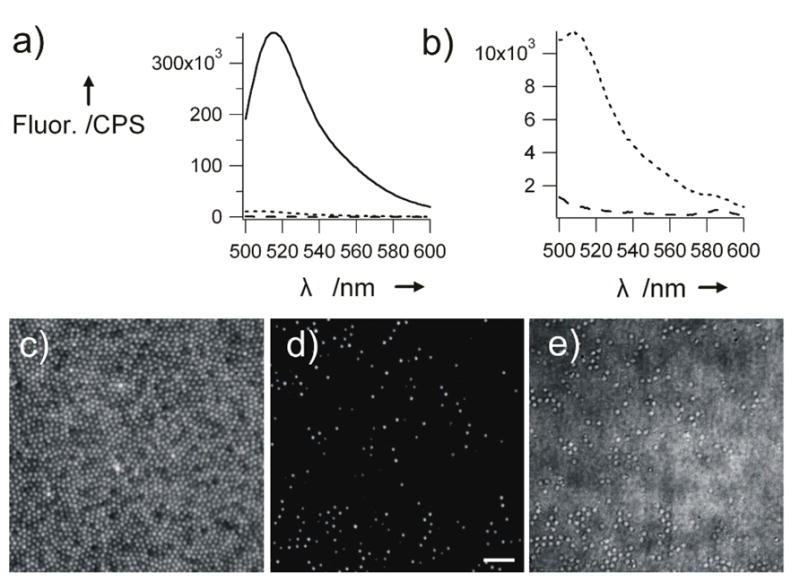
Fluorescence spectra, a) and b), of a 0.01 wt% solution of 3% cross-linked microgels (Dh = 648 nm) before (black) and after (dotted) filtration through 100 nm pores at pH 7. The black-dashed line in panel b) represents the pure pH 7 buffer. The spectrum of the filtrate is an average of 4 spectra. Panels (c), (d), and (e) are fluorescence microscopy images before and after flitration and a bright field microscopy image after filtration of the same microgels. Scale bar = 5 μm