
Figure 2.
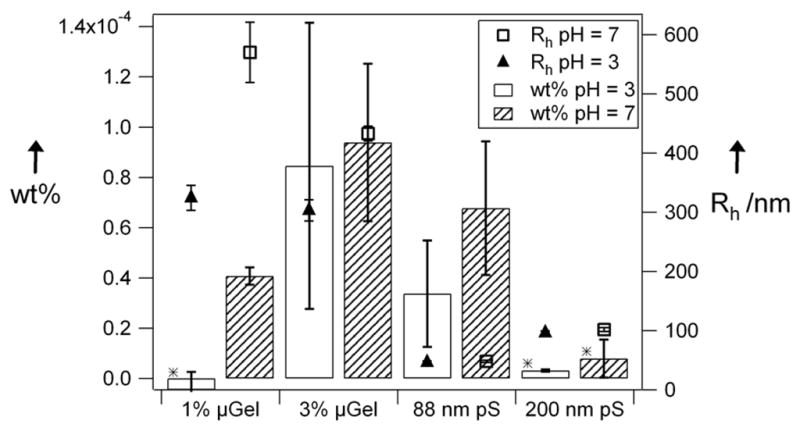
Filtration comparison of 1% and 3% microgels, 88 nm polystyrene, and 200 nm polystyrene particles (0.001 wt%). Error bars represent the uncertainty over 3 or 4 filtration experiments. Stars represent statistically significant data at the 95% confidence interval relative to 88 nm polystyrene at pH 7. Open circles are the hydrodynamic radii of particles at pH 7. Filled triangles are hydrodynamic radii of particles at pH 3.